【Python】圆柱体内部3D点云仿真及ply文件生成,圆形3D点云检测及拟合算法
更新以gitee为准:
管道内管壁ply点云生成及管道检测
文章目录
ply点云显示
通过plyfile库可以完成点云的读取或写入
同时 引入color map 使其与不同的深度值进行对应
ply读取函数如下:
python
color_map = [
    (128, 0, 0),     (132, 0, 0),     (136, 0, 0),     (140, 0, 0),
    (144, 0, 0),     (148, 0, 0),     (152, 0, 0),     (156, 0, 0),
    (160, 0, 0),     (164, 0, 0),     (168, 0, 0),     (172, 0, 0),
    (176, 0, 0),     (180, 0, 0),     (184, 0, 0),     (188, 0, 0),
    (192, 0, 0),     (196, 0, 0),     (200, 0, 0),     (204, 0, 0),
    (208, 0, 0),     (212, 0, 0),     (216, 0, 0),     (220, 0, 0),
    (224, 0, 0),     (228, 0, 0),     (232, 0, 0),     (236, 0, 0),
    (240, 0, 0),     (244, 0, 0),     (248, 0, 0),     (252, 0, 0),
    (255, 0, 0),     (255, 4, 0),     (255, 8, 0),     (255, 12, 0),
    (255, 16, 0),    (255, 20, 0),    (255, 24, 0),    (255, 28, 0),
    (255, 32, 0),    (255, 36, 0),    (255, 40, 0),    (255, 44, 0),
    (255, 48, 0),    (255, 52, 0),    (255, 56, 0),    (255, 60, 0),
    (255, 64, 0),    (255, 68, 0),    (255, 72, 0),    (255, 76, 0),
    (255, 80, 0),    (255, 84, 0),    (255, 88, 0),    (255, 92, 0),
    (255, 96, 0),    (255, 100, 0),   (255, 104, 0),   (255, 108, 0),
    (255, 112, 0),   (255, 116, 0),   (255, 120, 0),   (255, 124, 0),
    (255, 128, 0),   (255, 132, 0),   (255, 136, 0),   (255, 140, 0),
    (255, 144, 0),   (255, 148, 0),   (255, 152, 0),   (255, 156, 0),
    (255, 160, 0),   (255, 164, 0),   (255, 168, 0),   (255, 172, 0),
    (255, 176, 0),   (255, 180, 0),   (255, 184, 0),   (255, 188, 0),
    (255, 192, 0),   (255, 196, 0),   (255, 200, 0),   (255, 204, 0),
    (255, 208, 0),   (255, 212, 0),   (255, 216, 0),   (255, 220, 0),
    (255, 224, 0),   (255, 228, 0),   (255, 232, 0),   (255, 236, 0),
    (255, 240, 0),   (255, 244, 0),   (255, 248, 0),   (255, 252, 0),
    (254, 255, 1),   (250, 255, 6),   (246, 255, 10),  (242, 255, 14),
    (238, 255, 18),  (234, 255, 22),  (230, 255, 26),  (226, 255, 30),
    (222, 255, 34),  (218, 255, 38),  (214, 255, 42),  (210, 255, 46),
    (206, 255, 50),  (202, 255, 54),  (198, 255, 58),  (194, 255, 62),
    (190, 255, 66),  (186, 255, 70),  (182, 255, 74),  (178, 255, 78),
    (174, 255, 82),  (170, 255, 86),  (166, 255, 90),  (162, 255, 94),
    (158, 255, 98),  (154, 255, 102), (150, 255, 106), (146, 255, 110),
    (142, 255, 114), (138, 255, 118), (134, 255, 122), (130, 255, 126),
    (126, 255, 130), (122, 255, 134), (118, 255, 138), (114, 255, 142),
    (110, 255, 146), (106, 255, 150), (102, 255, 154), (98, 255, 158),
    (94, 255, 162),  (90, 255, 166),  (86, 255, 170),  (82, 255, 174),
    (78, 255, 178),  (74, 255, 182),  (70, 255, 186),  (66, 255, 190),
    (62, 255, 194),  (58, 255, 198),  (54, 255, 202),  (50, 255, 206),
    (46, 255, 210),  (42, 255, 214),  (38, 255, 218),  (34, 255, 222),
    (30, 255, 226),  (26, 255, 230),  (22, 255, 234),  (18, 255, 238),
    (14, 255, 242),  (10, 255, 246),  (6, 255, 250),   (2, 255, 254),
    (0, 252, 255),   (0, 248, 255),   (0, 244, 255),   (0, 240, 255),
    (0, 236, 255),   (0, 232, 255),   (0, 228, 255),   (0, 224, 255),
    (0, 220, 255),   (0, 216, 255),   (0, 212, 255),   (0, 208, 255),
    (0, 204, 255),   (0, 200, 255),   (0, 196, 255),   (0, 192, 255),
    (0, 188, 255),   (0, 184, 255),   (0, 180, 255),   (0, 176, 255),
    (0, 172, 255),   (0, 168, 255),   (0, 164, 255),   (0, 160, 255),
    (0, 156, 255),   (0, 152, 255),   (0, 148, 255),   (0, 144, 255),
    (0, 140, 255),   (0, 136, 255),   (0, 132, 255),   (0, 128, 255),
    (0, 124, 255),   (0, 120, 255),   (0, 116, 255),   (0, 112, 255),
    (0, 108, 255),   (0, 104, 255),   (0, 100, 255),   (0, 96, 255),
    (0, 92, 255),    (0, 88, 255),    (0, 84, 255),    (0, 80, 255),
    (0, 76, 255),    (0, 72, 255),    (0, 68, 255),    (0, 64, 255),
    (0, 60, 255),    (0, 56, 255),    (0, 52, 255),    (0, 48, 255),
    (0, 44, 255),    (0, 40, 255),    (0, 36, 255),    (0, 32, 255),
    (0, 28, 255),    (0, 24, 255),    (0, 20, 255),    (0, 16, 255),
    (0, 12, 255),    (0, 8, 255),     (0, 4, 255),     (0, 0, 255),
    (0, 0, 252),     (0, 0, 248),     (0, 0, 244),     (0, 0, 240),
    (0, 0, 236),     (0, 0, 232),     (0, 0, 228),     (0, 0, 224),
    (0, 0, 220),     (0, 0, 216),     (0, 0, 212),     (0, 0, 208),
    (0, 0, 204),     (0, 0, 200),     (0, 0, 196),     (0, 0, 192),
    (0, 0, 188),     (0, 0, 184),     (0, 0, 180),     (0, 0, 176),
    (0, 0, 172),     (0, 0, 168),     (0, 0, 164),     (0, 0, 160),
    (0, 0, 156),     (0, 0, 152),     (0, 0, 148),     (0, 0, 144),
    (0, 0, 140),     (0, 0, 136),     (0, 0, 132),     (0, 0, 128)
]

def visualize_ply(file_path):
    # 读取PLY文件
    ply_data = PlyData.read(file_path)
    vertices = ply_data['vertex']

    # 提取坐标数据
    x = vertices['x']
    y = vertices['y']
    z = vertices['z']

    # 计算深度范围
    min_depth = np.min(z)
    max_depth = np.max(z)
    depth_range = max_depth - min_depth

    # 生成颜色映射
    colors = []
    for depth in z:
        # 将深度映射到颜色索引 (0-255)
        color_idx = int(((depth - min_depth) / depth_range) * (len(color_map)-1))
        colors.append(color_map[color_idx])

    # 转换为0-1范围的RGB值
    colors = np.array(colors) / 255.0

    # 创建3D可视化
    fig = plt.figure(figsize=(10, 8))
    ax = fig.add_subplot(111, projection='3d')

    # 绘制点云
    ax.scatter(x, y, z, c=colors, s=1, marker='o')

    # 设置坐标轴标签
    ax.set_xlabel('X')
    ax.set_ylabel('Y')
    ax.set_zlabel('Z')

    # 启用交互式旋转
    plt.show(block=True)  # 添加block=True参数保持窗口显示
点云生成
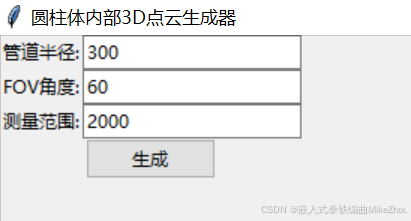
建立一个tkinter界面 用于生成
其中 fov角度的引入表示 某一传感器防止在圆柱体内部中心位置 延伸z轴的正向延长方向上做检测 传感器测量范围有限 那么最近的一个点距离S与fov的关系为:
sin(fov/2)=R/S
python
min_range = radius / math.sin(math.radians(fov_deg / 2))即最大fov角度时 测到的管壁的第一个点 其必须小于测量范围 否则就完全测不到
对应的z轴最小范围为:
python
min_distance = radius / math.tan(math.radians(fov_deg / 2))当测得最远的一个点时 其斜边为最大测量范围 那么此时对应的角度a与半径关系为:
sin(a)=R/max_range
求得的a要小于fov/2才行
根据几何关系如果第一个点能被测得到 那么距离最大的一个点肯定也能被侧得到
但也可加上条件判断
python
    a_rad = math.asin(radius / max_range)
    a_deg = math.degrees(a_rad)
    if a_deg > fov_deg / 2:
        return None
此时 距离最大值是斜边 半径为对边 z轴最大距离s为临边
那么z轴最大距离即为:
python
max_distance = math.sqrt(max_range**2 - radius**2)最后再加上点的数量、噪音、以及近距离分布多 远距离分布少的系数得到
生成函数为:
python
def generate_cylinder(radius, fov_deg, max_range, points=5000,noise=5,coefficient=4):
    if radius <= 0 or fov_deg <= 0 or max_range <= 0:
        return None

    if fov_deg > 180:
        return None

    if radius >= max_range:
        return None

    if points <= 0:
        return None

    min_range = radius / math.sin(math.radians(fov_deg / 2))
    if min_range > max_range:
        return None

    max_distance = math.sqrt(max_range**2 - radius**2)
    min_distance = radius / math.tan(math.radians(fov_deg / 2))

    if max_distance <= min_distance or max_distance <= 0 or min_distance <= 0:
        return None

    a_rad = math.asin(radius / max_range)
    a_deg = math.degrees(a_rad)
    if a_deg > fov_deg / 2:
        return None

    # 生成圆柱面点云
    theta = np.random.uniform(0, 2*math.pi, points)

    u = np.random.rand(points)
    z = max_distance - (max_distance - min_distance) * np.power(u,1/coefficient)
    # z = np.random.uniform(min_distance, max_distance, points)

    # 转换为笛卡尔坐标(管壁表面)
    radius_noise = np.random.normal(0, noise, points)
    radius += radius_noise
    x = radius * np.cos(theta)
    y = radius * np.sin(theta)

    x_noise = np.random.normal(0, noise, points)
    y_noise = np.random.normal(0, noise, points)

    x +=  x_noise
    y +=  y_noise

    return x, y, z
保存ply并显示:
python
# 创建PLY结构并保存(保留原有实现)
vertices = np.zeros(len(x), dtype=[('x', 'f4'), ('y', 'f4'), ('z', 'f4')])
vertices['x'], vertices['y'], vertices['z'] = x, y, z
ply = PlyData([PlyElement.describe(vertices, 'vertex')], text=True)
ply.write('tube.ply')
# 调用可视化
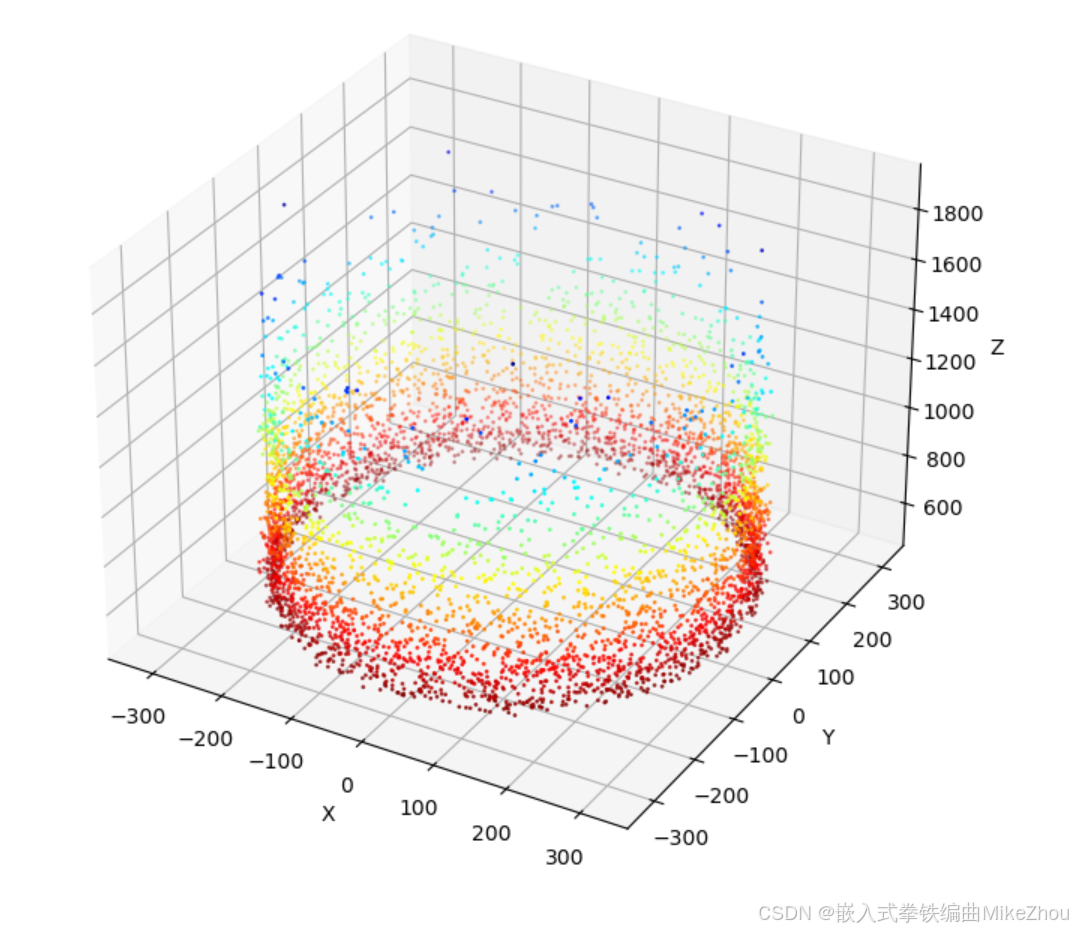
visualize_ply('tube.ply')点云生成完整代码
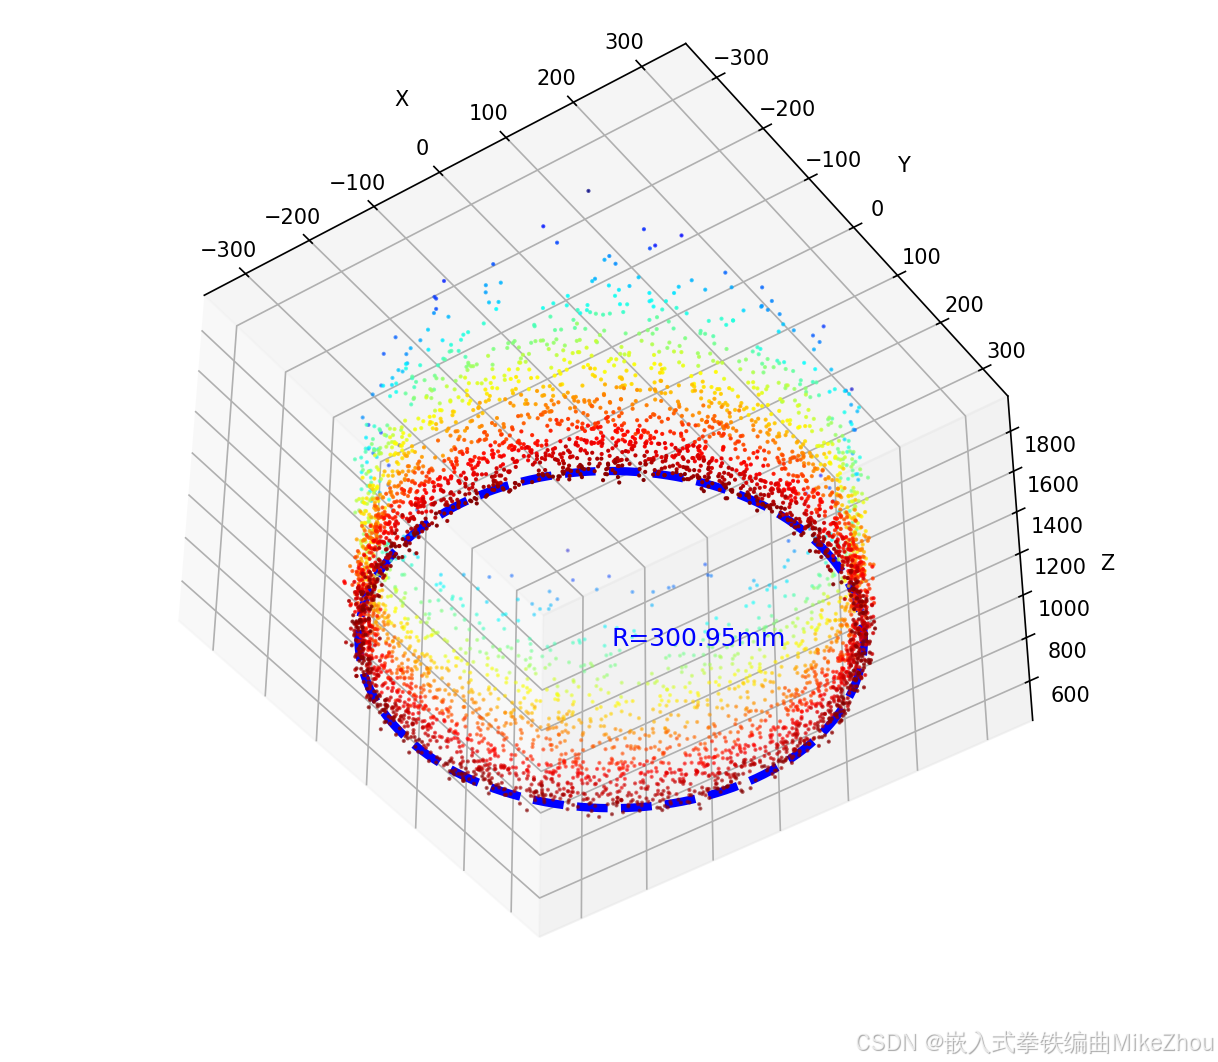
默认半径300 fov60 测量距离2000 得到的最后效果:
python
import numpy as np
import matplotlib.pyplot as plt
from plyfile import PlyData, PlyElement
import tkinter as tk
from tkinter import ttk
import math
from tkinter import messagebox

color_map = [
    (128, 0, 0),     (132, 0, 0),     (136, 0, 0),     (140, 0, 0),
    (144, 0, 0),     (148, 0, 0),     (152, 0, 0),     (156, 0, 0),
    (160, 0, 0),     (164, 0, 0),     (168, 0, 0),     (172, 0, 0),
    (176, 0, 0),     (180, 0, 0),     (184, 0, 0),     (188, 0, 0),
    (192, 0, 0),     (196, 0, 0),     (200, 0, 0),     (204, 0, 0),
    (208, 0, 0),     (212, 0, 0),     (216, 0, 0),     (220, 0, 0),
    (224, 0, 0),     (228, 0, 0),     (232, 0, 0),     (236, 0, 0),
    (240, 0, 0),     (244, 0, 0),     (248, 0, 0),     (252, 0, 0),
    (255, 0, 0),     (255, 4, 0),     (255, 8, 0),     (255, 12, 0),
    (255, 16, 0),    (255, 20, 0),    (255, 24, 0),    (255, 28, 0),
    (255, 32, 0),    (255, 36, 0),    (255, 40, 0),    (255, 44, 0),
    (255, 48, 0),    (255, 52, 0),    (255, 56, 0),    (255, 60, 0),
    (255, 64, 0),    (255, 68, 0),    (255, 72, 0),    (255, 76, 0),
    (255, 80, 0),    (255, 84, 0),    (255, 88, 0),    (255, 92, 0),
    (255, 96, 0),    (255, 100, 0),   (255, 104, 0),   (255, 108, 0),
    (255, 112, 0),   (255, 116, 0),   (255, 120, 0),   (255, 124, 0),
    (255, 128, 0),   (255, 132, 0),   (255, 136, 0),   (255, 140, 0),
    (255, 144, 0),   (255, 148, 0),   (255, 152, 0),   (255, 156, 0),
    (255, 160, 0),   (255, 164, 0),   (255, 168, 0),   (255, 172, 0),
    (255, 176, 0),   (255, 180, 0),   (255, 184, 0),   (255, 188, 0),
    (255, 192, 0),   (255, 196, 0),   (255, 200, 0),   (255, 204, 0),
    (255, 208, 0),   (255, 212, 0),   (255, 216, 0),   (255, 220, 0),
    (255, 224, 0),   (255, 228, 0),   (255, 232, 0),   (255, 236, 0),
    (255, 240, 0),   (255, 244, 0),   (255, 248, 0),   (255, 252, 0),
    (254, 255, 1),   (250, 255, 6),   (246, 255, 10),  (242, 255, 14),
    (238, 255, 18),  (234, 255, 22),  (230, 255, 26),  (226, 255, 30),
    (222, 255, 34),  (218, 255, 38),  (214, 255, 42),  (210, 255, 46),
    (206, 255, 50),  (202, 255, 54),  (198, 255, 58),  (194, 255, 62),
    (190, 255, 66),  (186, 255, 70),  (182, 255, 74),  (178, 255, 78),
    (174, 255, 82),  (170, 255, 86),  (166, 255, 90),  (162, 255, 94),
    (158, 255, 98),  (154, 255, 102), (150, 255, 106), (146, 255, 110),
    (142, 255, 114), (138, 255, 118), (134, 255, 122), (130, 255, 126),
    (126, 255, 130), (122, 255, 134), (118, 255, 138), (114, 255, 142),
    (110, 255, 146), (106, 255, 150), (102, 255, 154), (98, 255, 158),
    (94, 255, 162),  (90, 255, 166),  (86, 255, 170),  (82, 255, 174),
    (78, 255, 178),  (74, 255, 182),  (70, 255, 186),  (66, 255, 190),
    (62, 255, 194),  (58, 255, 198),  (54, 255, 202),  (50, 255, 206),
    (46, 255, 210),  (42, 255, 214),  (38, 255, 218),  (34, 255, 222),
    (30, 255, 226),  (26, 255, 230),  (22, 255, 234),  (18, 255, 238),
    (14, 255, 242),  (10, 255, 246),  (6, 255, 250),   (2, 255, 254),
    (0, 252, 255),   (0, 248, 255),   (0, 244, 255),   (0, 240, 255),
    (0, 236, 255),   (0, 232, 255),   (0, 228, 255),   (0, 224, 255),
    (0, 220, 255),   (0, 216, 255),   (0, 212, 255),   (0, 208, 255),
    (0, 204, 255),   (0, 200, 255),   (0, 196, 255),   (0, 192, 255),
    (0, 188, 255),   (0, 184, 255),   (0, 180, 255),   (0, 176, 255),
    (0, 172, 255),   (0, 168, 255),   (0, 164, 255),   (0, 160, 255),
    (0, 156, 255),   (0, 152, 255),   (0, 148, 255),   (0, 144, 255),
    (0, 140, 255),   (0, 136, 255),   (0, 132, 255),   (0, 128, 255),
    (0, 124, 255),   (0, 120, 255),   (0, 116, 255),   (0, 112, 255),
    (0, 108, 255),   (0, 104, 255),   (0, 100, 255),   (0, 96, 255),
    (0, 92, 255),    (0, 88, 255),    (0, 84, 255),    (0, 80, 255),
    (0, 76, 255),    (0, 72, 255),    (0, 68, 255),    (0, 64, 255),
    (0, 60, 255),    (0, 56, 255),    (0, 52, 255),    (0, 48, 255),
    (0, 44, 255),    (0, 40, 255),    (0, 36, 255),    (0, 32, 255),
    (0, 28, 255),    (0, 24, 255),    (0, 20, 255),    (0, 16, 255),
    (0, 12, 255),    (0, 8, 255),     (0, 4, 255),     (0, 0, 255),
    (0, 0, 252),     (0, 0, 248),     (0, 0, 244),     (0, 0, 240),
    (0, 0, 236),     (0, 0, 232),     (0, 0, 228),     (0, 0, 224),
    (0, 0, 220),     (0, 0, 216),     (0, 0, 212),     (0, 0, 208),
    (0, 0, 204),     (0, 0, 200),     (0, 0, 196),     (0, 0, 192),
    (0, 0, 188),     (0, 0, 184),     (0, 0, 180),     (0, 0, 176),
    (0, 0, 172),     (0, 0, 168),     (0, 0, 164),     (0, 0, 160),
    (0, 0, 156),     (0, 0, 152),     (0, 0, 148),     (0, 0, 144),
    (0, 0, 140),     (0, 0, 136),     (0, 0, 132),     (0, 0, 128)
]

def visualize_ply(file_path):
    # 读取PLY文件
    ply_data = PlyData.read(file_path)
    vertices = ply_data['vertex']

    # 提取坐标数据
    x = vertices['x']
    y = vertices['y']
    z = vertices['z']

    # 计算深度范围
    min_depth = np.min(z)
    max_depth = np.max(z)
    depth_range = max_depth - min_depth

    # 生成颜色映射
    colors = []
    for depth in z:
        # 将深度映射到颜色索引 (0-255)
        color_idx = int(((depth - min_depth) / depth_range) * (len(color_map)-1))
        colors.append(color_map[color_idx])

    # 转换为0-1范围的RGB值
    colors = np.array(colors) / 255.0

    # 创建3D可视化
    fig = plt.figure(figsize=(10, 8))
    ax = fig.add_subplot(111, projection='3d')

    # 绘制点云
    ax.scatter(x, y, z, c=colors, s=1, marker='o')

    # 设置坐标轴标签
    ax.set_xlabel('X')
    ax.set_ylabel('Y')
    ax.set_zlabel('Z')

    # 启用交互式旋转
    plt.show(block=True)  # 添加block=True参数保持窗口显示

# 在文件末尾添加以下新功能
def generate_cylinder(radius, fov_deg, max_range, points=5000,noise=5,coefficient=4):
    if radius <= 0 or fov_deg <= 0 or max_range <= 0:
        return None

    if fov_deg > 180:
        return None

    if radius >= max_range:
        return None

    if points <= 0:
        return None

    min_range = radius / math.sin(math.radians(fov_deg / 2))
    if min_range > max_range:
        return None

    max_distance = math.sqrt(max_range**2 - radius**2)
    min_distance = radius / math.tan(math.radians(fov_deg / 2))

    if max_distance <= min_distance or max_distance <= 0 or min_distance <= 0:
        return None

    a_rad = math.asin(radius / max_range)
    a_deg = math.degrees(a_rad)
    if a_deg > fov_deg / 2:
        return None

    # 生成圆柱面点云
    theta = np.random.uniform(0, 2*math.pi, points)

    u = np.random.rand(points)
    z = max_distance - (max_distance - min_distance) * np.power(u,1/coefficient)
    # z = np.random.uniform(min_distance, max_distance, points)

    # 转换为笛卡尔坐标(管壁表面)
    radius_noise = np.random.normal(0, noise, points)
    radius += radius_noise
    x = radius * np.cos(theta)
    y = radius * np.sin(theta)

    x_noise = np.random.normal(0, noise, points)
    y_noise = np.random.normal(0, noise, points)

    x +=  x_noise
    y +=  y_noise

    return x, y, z

class CylinderGUI:
    def __init__(self):
        self.root = tk.Tk()
        self.root.title('圆柱体内部3D点云生成器')

        ttk.Label(self.root, text='管道半径:').grid(row=0, column=0)
        self.radius_entry = ttk.Entry(self.root)
        self.radius_entry.insert(0, '300')
        self.radius_entry.grid(row=0, column=1)

        # 更新输入控件
        ttk.Label(self.root, text='FOV角度:').grid(row=1, column=0)
        self.fov_entry = ttk.Entry(self.root)
        self.fov_entry.insert(0, '60')
        self.fov_entry.grid(row=1, column=1)

        ttk.Label(self.root, text='测量范围:').grid(row=2, column=0)
        self.range_entry = ttk.Entry(self.root)
        self.range_entry.insert(0, '2000')
        self.range_entry.grid(row=2, column=1)

        # 生成按钮
        self.generate_btn = ttk.Button(self.root, text='生成', command=self.generate)
        self.generate_btn.grid(row=3, columnspan=2)

    def generate(self):
        try:
            fov = float(self.fov_entry.get())
            max_range = float(self.range_entry.get())
            radius = float(self.radius_entry.get())

            # 调用新的生成函数
            li = generate_cylinder(
                radius=radius,
                fov_deg=fov,
                max_range=max_range
            )

            if li is None:
                messagebox.showwarning("警告", "未生成有效点云,请调整检测参数")
                return

            x, y, z = li

            # 创建PLY结构并保存(保留原有实现)
            vertices = np.zeros(len(x), dtype=[('x', 'f4'), ('y', 'f4'), ('z', 'f4')])
            vertices['x'], vertices['y'], vertices['z'] = x, y, z

            ply = PlyData([PlyElement.describe(vertices, 'vertex')], text=True)
            ply.write('tube.ply')

            # 调用可视化
            visualize_ply('tube.ply')

        except ValueError as e:
            print(f"参数错误: {e}")

if __name__ == "__main__":
    gui = CylinderGUI()
    gui.root.mainloop()
圆形3D点云检测及拟合算法
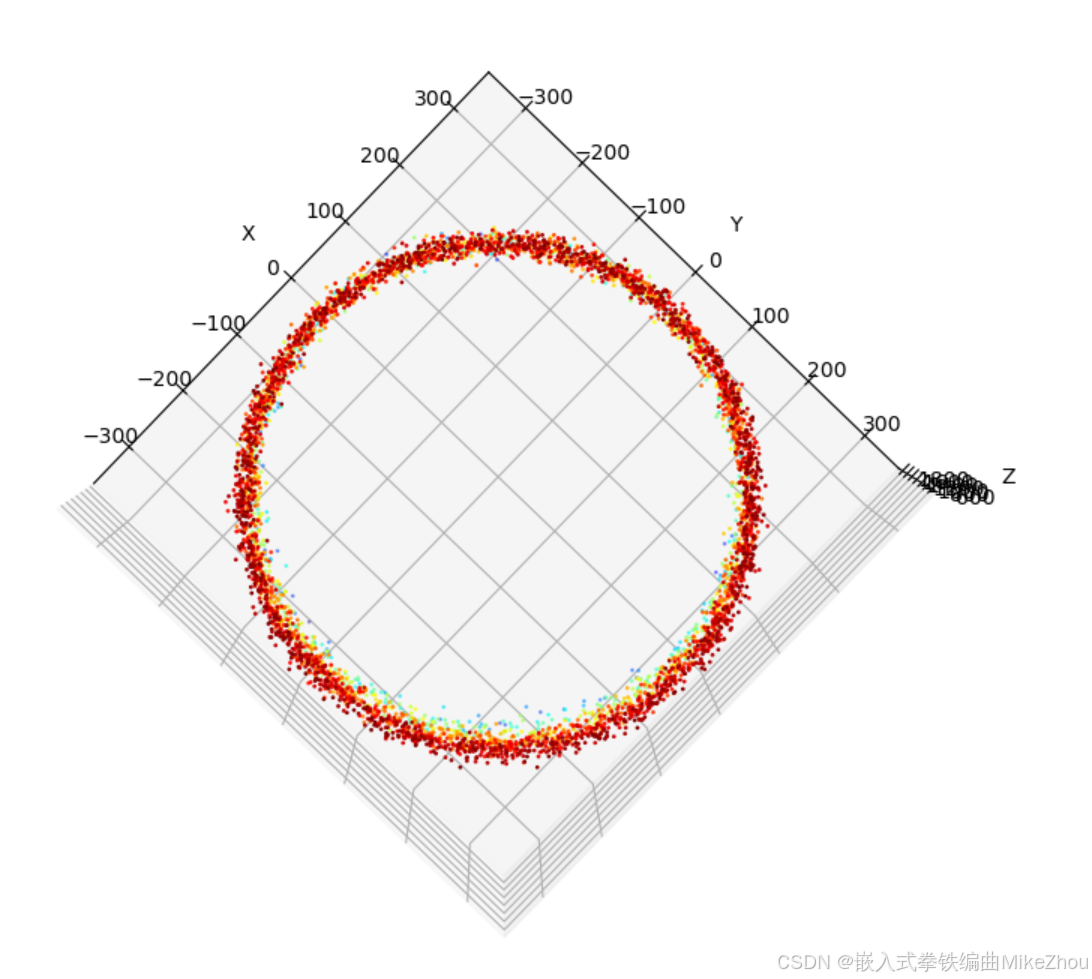
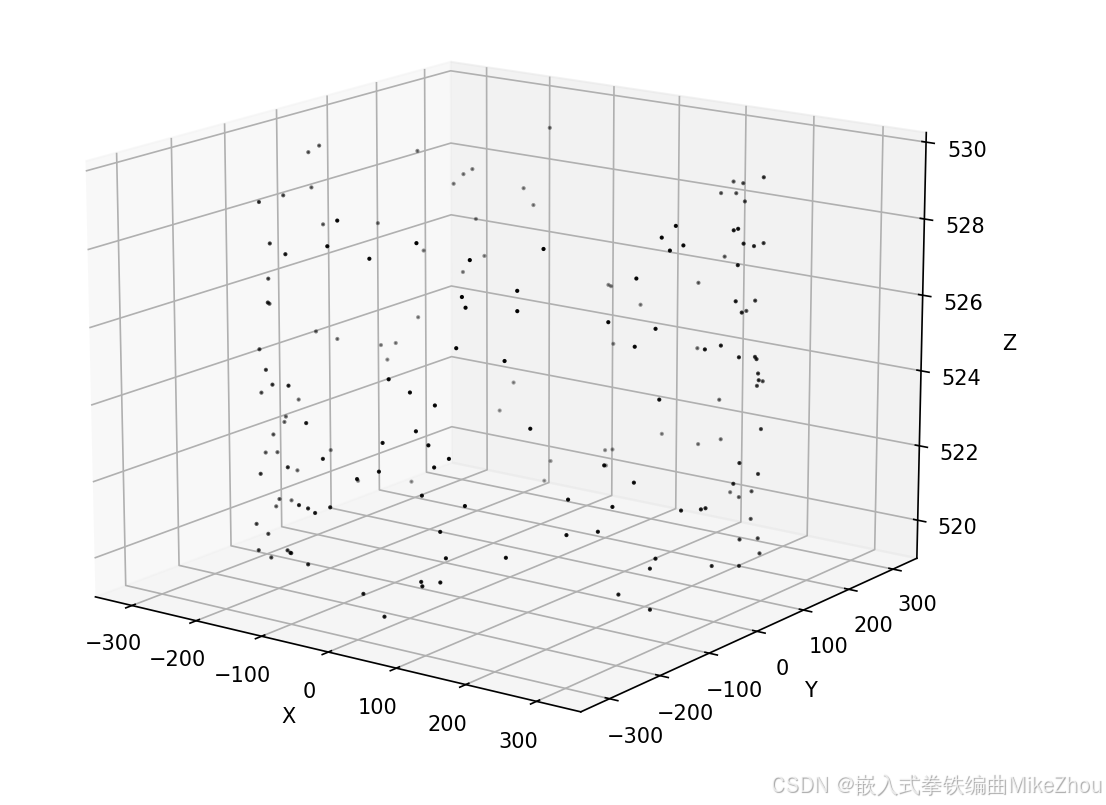
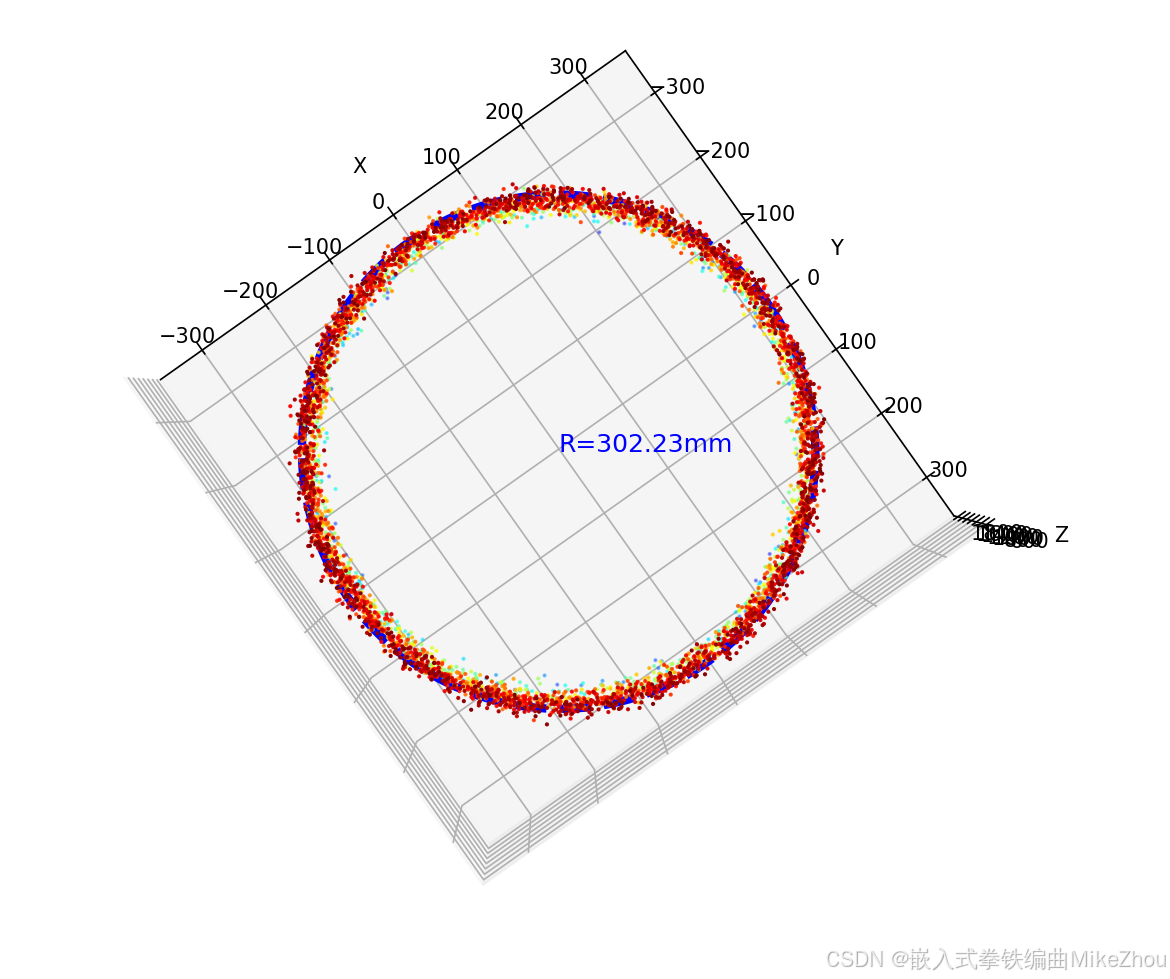
获取最密集部分点云
获取到的点云图 其在xy平面是一个圆 所以可以根据几何特性来进行拟合
由于生成的点云近处密集 远处较疏 所以先筛选出一段范围内密集的点
python
# 读取PLY文件
    ply_data = PlyData.read(ply_file)
    vertices = ply_data['vertex']

    # 提取坐标数据
    x = vertices['x']
    y = vertices['y']
    z = vertices['z']

    # 计算深度范围
    min_depth = np.min(z)
    max_depth = np.max(z)
    depth_range = max_depth - min_depth

    # 筛选深度在指定范围内的点
    x_list = []
    y_list = []
    z_list = []

    # 动态计算bins数量(每个区间宽度为choose_depth)
    num_bins = int(np.ceil(depth_range / choose_depth))

    # 生成直方图
    hist, bin_edges = np.histogram(z, bins=num_bins, range=(min_depth, max_depth))
    max_bin_index = np.argmax(hist)
    z_min = bin_edges[max_bin_index]
    z_max = bin_edges[max_bin_index + 1]

    x_list = []
    y_list = []
    z_list = []

    # 筛选最密集区间内的点
    for i in range(len(z)):
        if z[i] >= z_min and z[i] <= z_max:
            x_list.append(x[i])
            y_list.append(y[i])
            z_list.append(z[i])

    # 在筛选点之后添加以下代码
    points = np.column_stack((x_list, y_list, z_list))
而后再进行圆形拟合算法
随机取三点
在这部分随机取三点 进行组合
这里的点不重复
python
def detect_circle_radom_3_points(points,retry_num=3):
    circle_points=[]
    circle_r=[]

    for j in range(retry_num):
        # 打乱点集顺序
        shuffled_points = np.random.permutation(points)

        i = 0
        while i < len(shuffled_points) - 2:
            # 取连续三个不重复的点
            triplet = shuffled_points[i:i+3]

            # 计算圆心和半径
            center, radius = calculate_circle(*triplet)

            if center is not None and radius is not None:
                circle_points.append(center)

                circle_r.append(radius)

            # 跳过已处理的点
            i += 3

    return circle_points, circle_r
同时 通过retry_num循环进行随机重复取值
求三点共圆进行拟合
假定圆的平面在X Y平面上 第三个点求其两个点的投影所在共圆面上 即可得到多个圆
python
def calculate_circle(p1, p2, p3):
    # 转换为二维坐标(假设在XY平面)
    p1_2d = p1[:2]
    p2_2d = p2[:2]
    p3_2d = p3[:2]

    # 检查共线性
    if np.linalg.matrix_rank([p2_2d - p1_2d, p3_2d - p1_2d]) < 2:
        return None, None

    # 构建2x2系数矩阵
    A = np.array([
        [2*(p2_2d[0] - p1_2d[0]), 2*(p2_2d[1] - p1_2d[1])],
        [2*(p3_2d[0] - p2_2d[0]), 2*(p3_2d[1] - p2_2d[1])]
    ])

    # 构建常数项
    b = np.array([
        p2_2d[0]**2 - p1_2d[0]**2 + p2_2d[1]**2 - p1_2d[1]**2,
        p3_2d[0]**2 - p2_2d[0]**2 + p3_2d[1]**2 - p2_2d[1]**2
    ])

    try:
        center_2d = np.linalg.solve(A, b)
        radius = np.linalg.norm(center_2d - p1_2d)
        # 恢复z坐标为三点平均值
        z_center = (p1[2] + p2[2] + p3[2]) / 3
        return np.array([center_2d[0], center_2d[1], z_center]), radius
    except np.linalg.LinAlgError:
        return None, None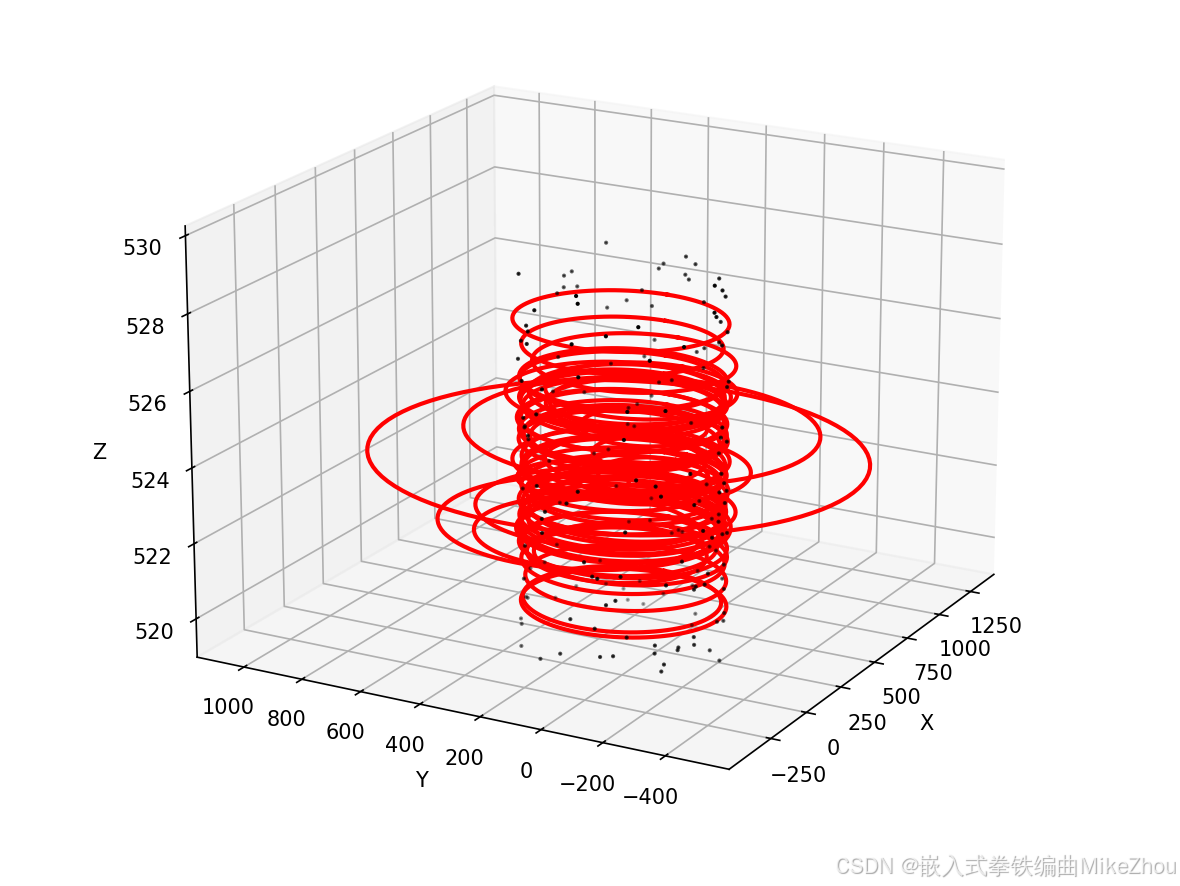
每次结果都是随机的
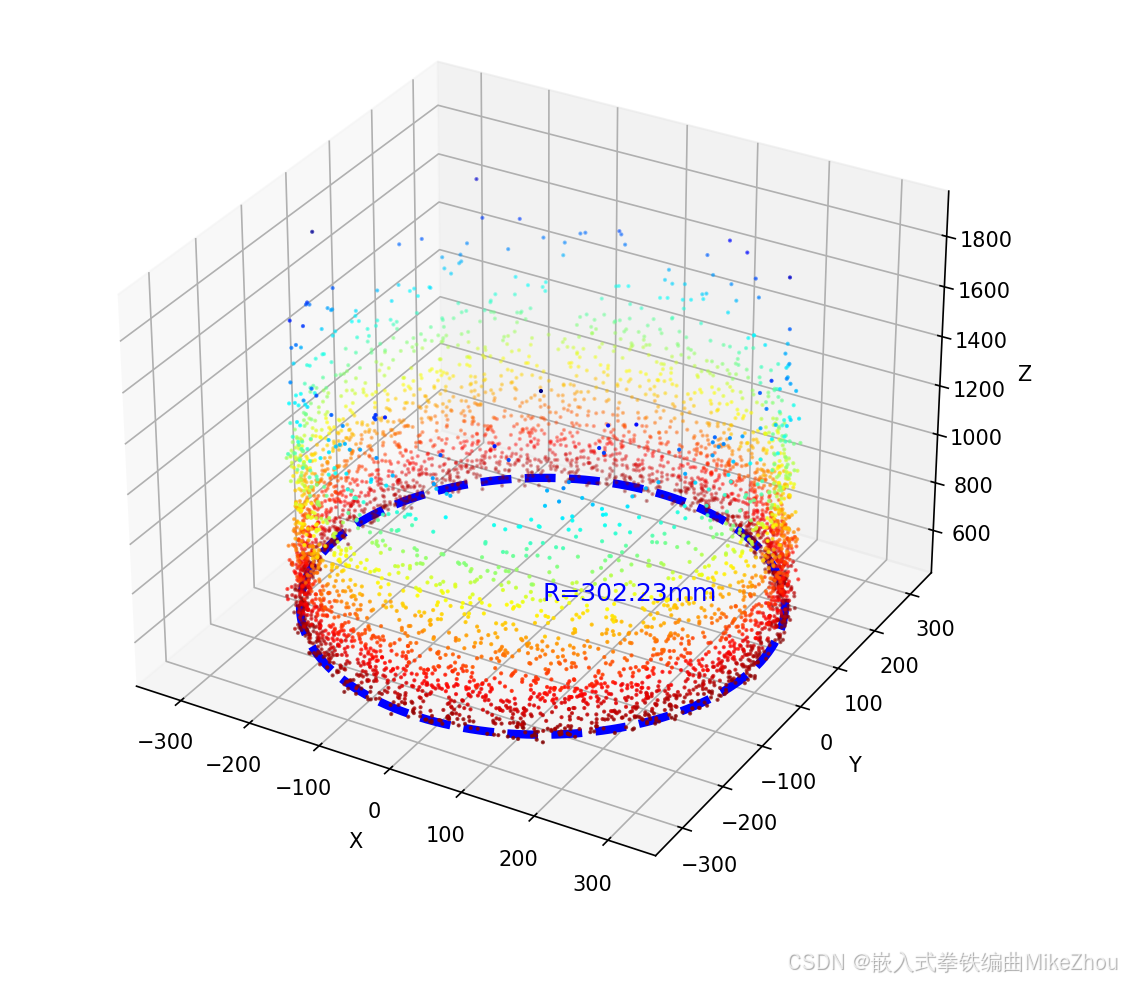
最终圆的拟合
通过过滤掉异常半径值 并进行加权平均计算 得到最后的圆心和半径:
python
def detect_circle(circle_points,circle_r):
    if len(circle_points) > 0:
        # 过滤异常半径(超过1.5倍IQR)
        radii = np.array(circle_r)
        q75, q25 = np.percentile(radii, [75, 25])
        iqr = q75 - q25
        mask = (radii > q25 - 1.5*iqr) & (radii < q75 + 1.5*iqr)

        # 计算加权平均值(根据半径密度加权)
        filtered_points = np.array(circle_points)[mask]
        filtered_radii = radii[mask]

        # 使用核密度估计找到最密集区域
        kde = gaussian_kde(filtered_radii)
        xvals = np.linspace(min(filtered_radii), max(filtered_radii), 100)
        kde_vals = kde(xvals)
        best_radius = xvals[np.argmax(kde_vals)]

        # 找到对应半径的所有圆心
        candidate_centers = filtered_points[np.abs(filtered_radii - best_radius) < iqr*0.5]

        # 取三维坐标中位数作为最终圆心
        final_center = np.median(candidate_centers, axis=0)
        final_radius = np.median(filtered_radii)

    return final_center,final_radius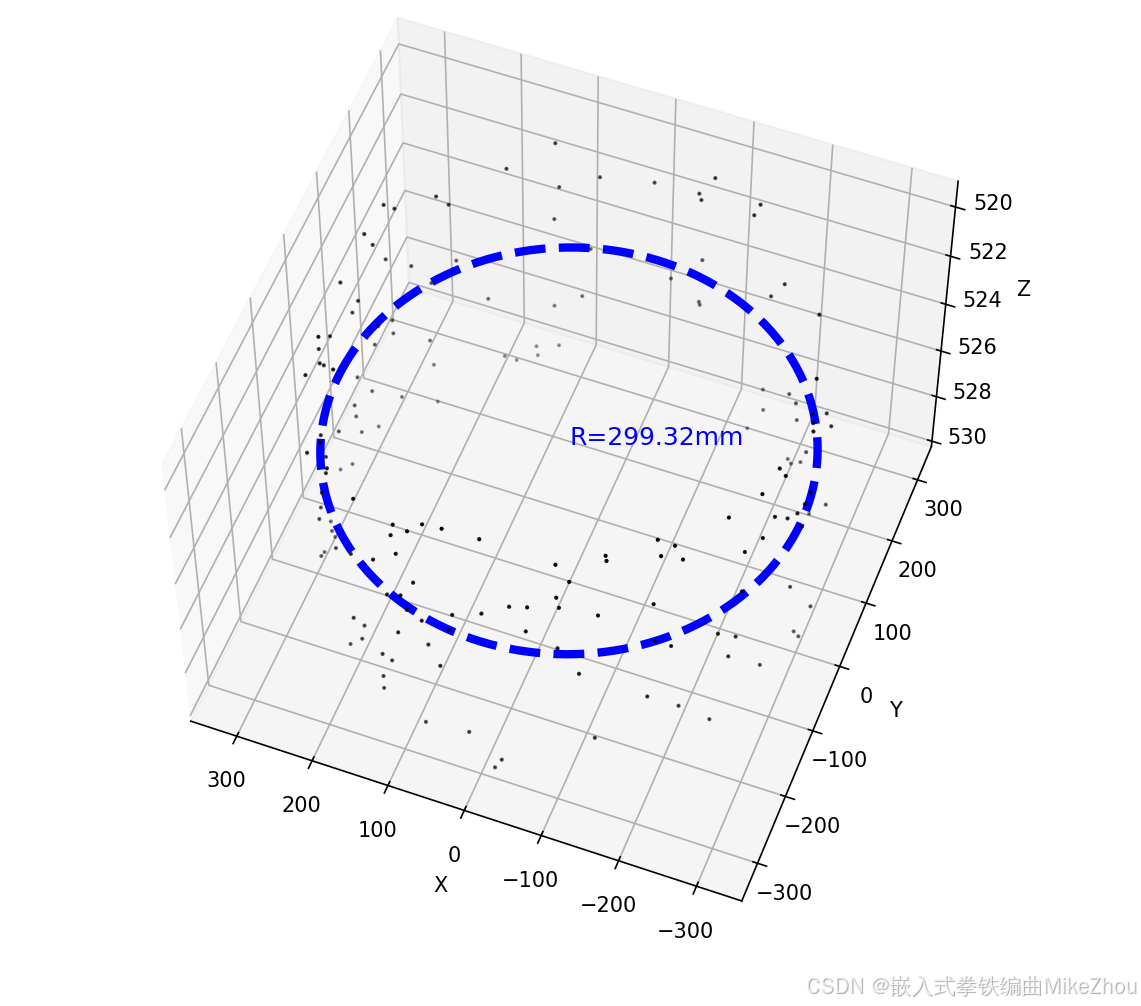
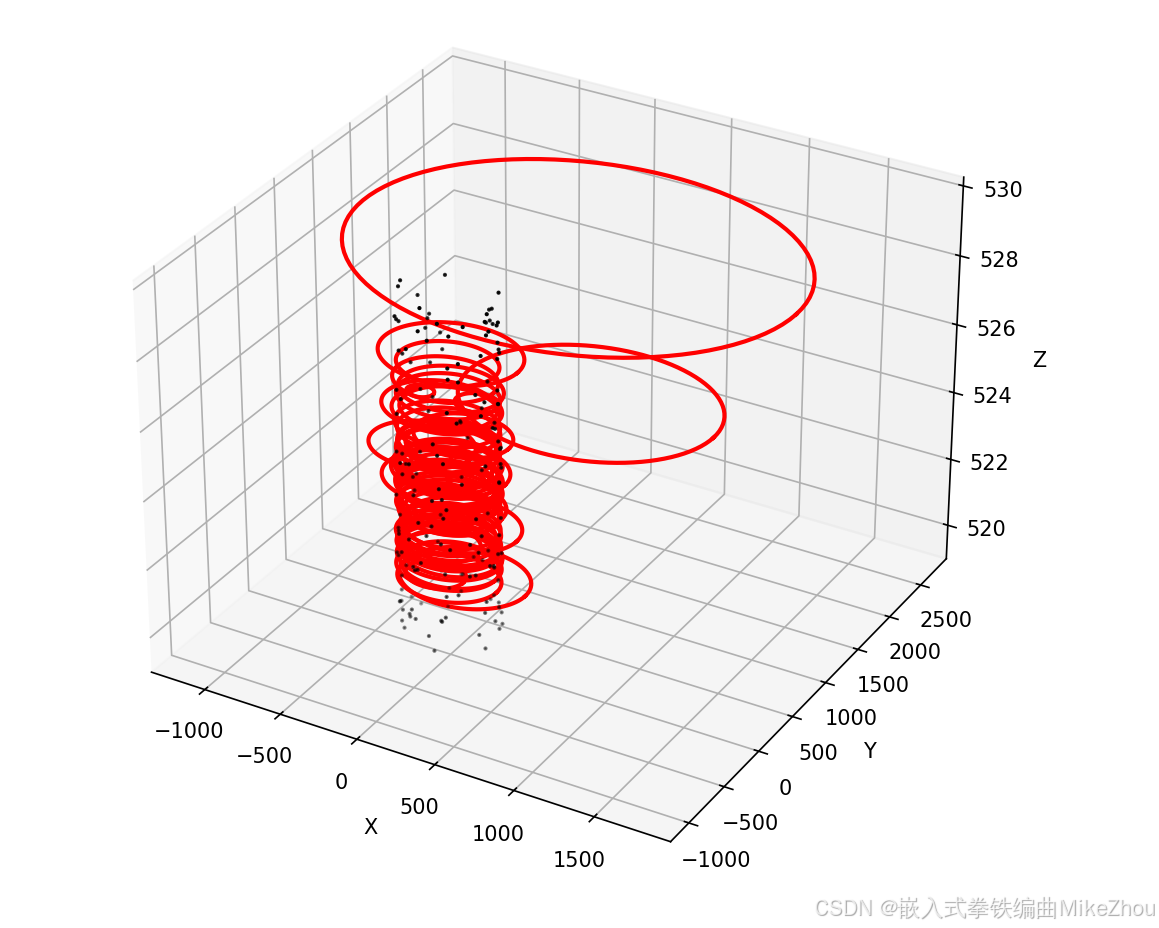
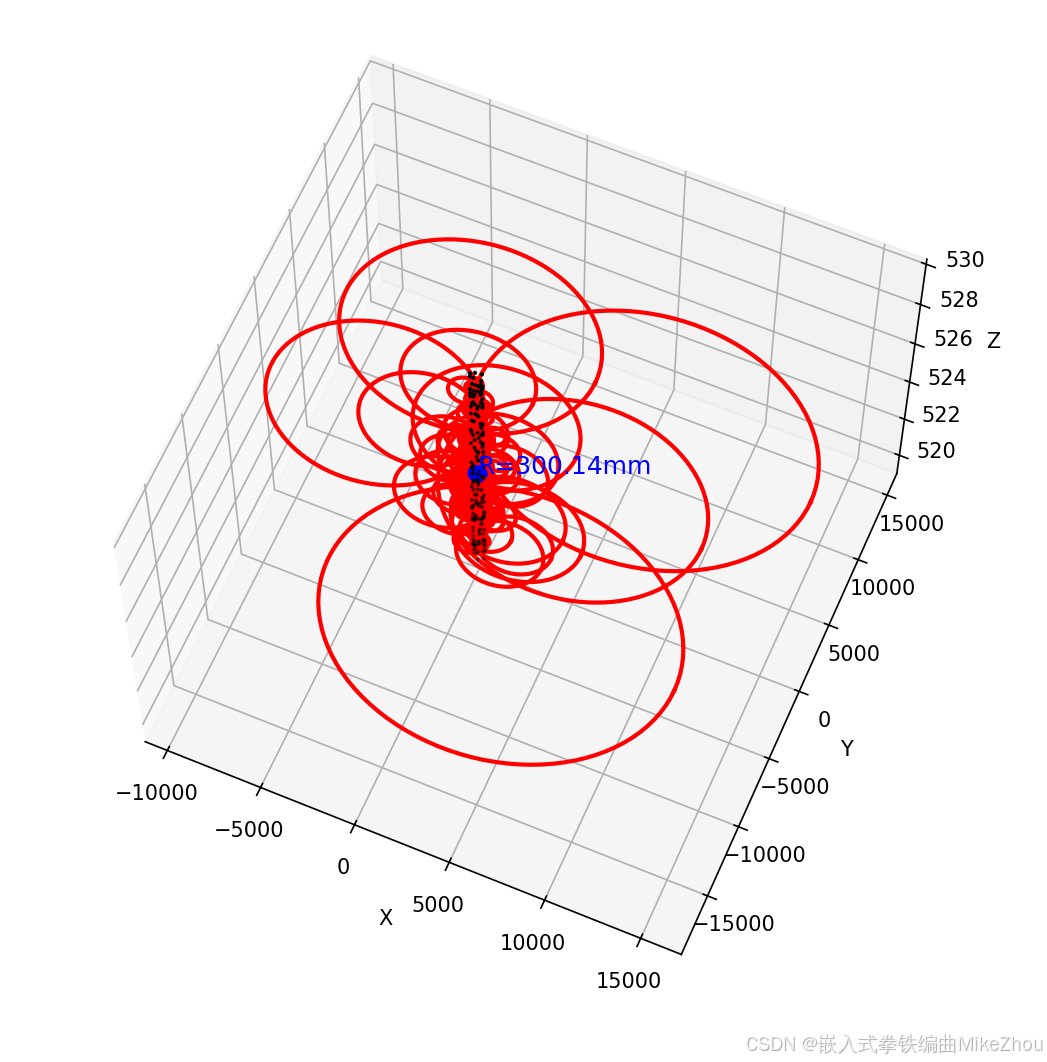
如果加上刚刚的三次循环读取 则增加圆的数量:
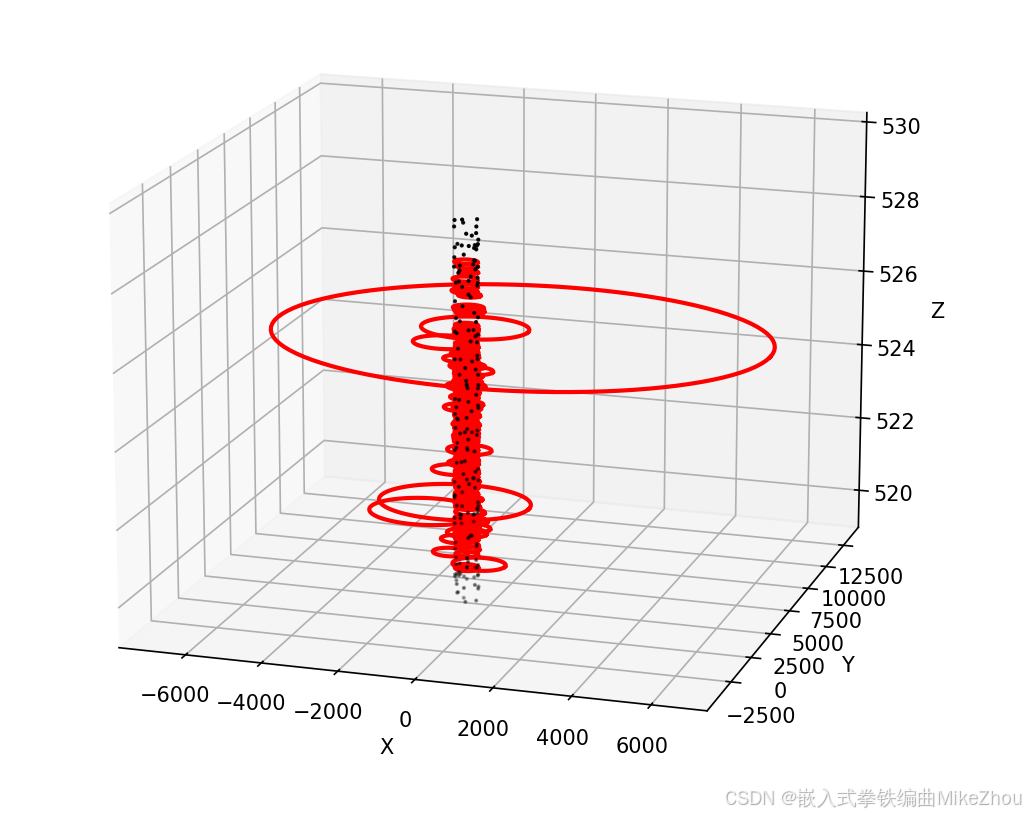
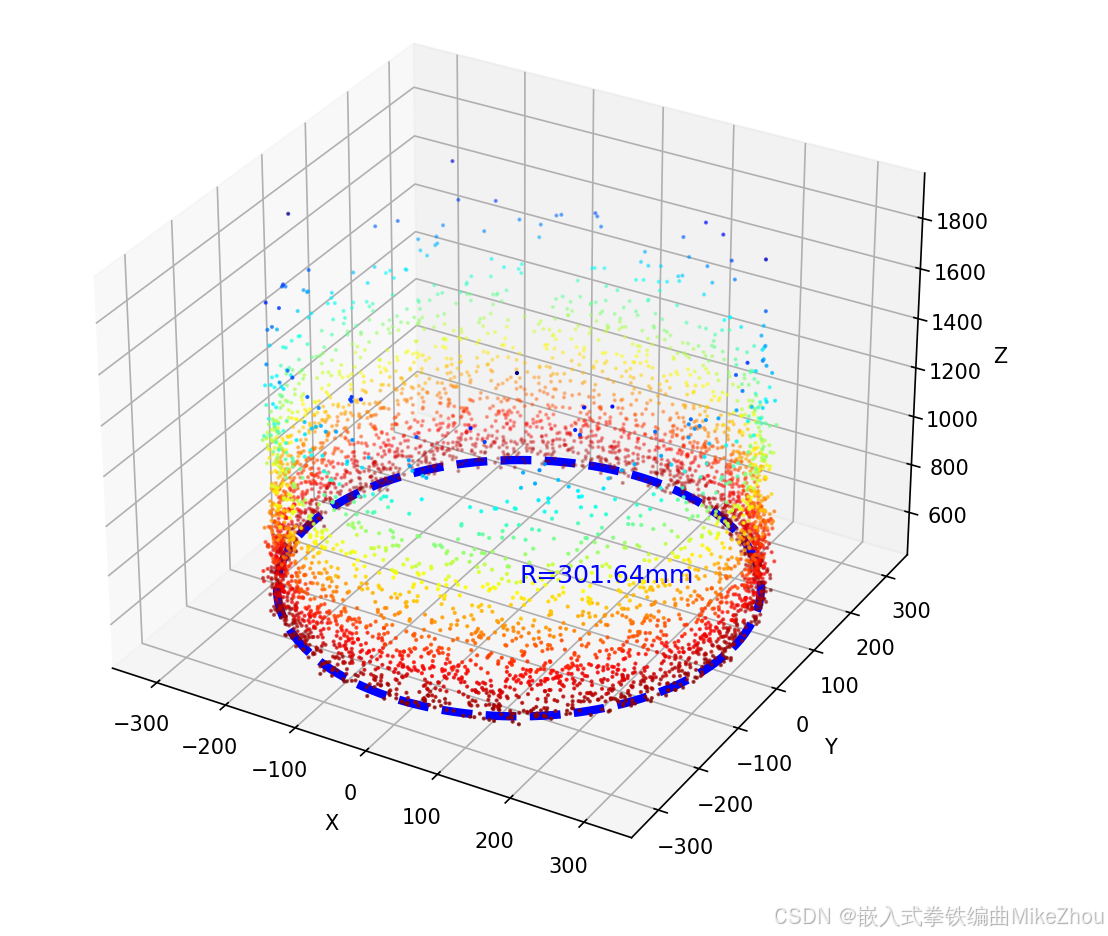
最终结果和代码
当然 每次随机取值得到的圆也不一样 所以每次的结果都有略微偏差 可以对最后的结果进行滤波再整合
python
from tube_generate import *
import numpy as np
import matplotlib.pyplot as plt
from plyfile import PlyData, PlyElement
import math
from scipy.stats import gaussian_kde
def calculate_circle(p1, p2, p3):
# 转换为二维坐标(假设在XY平面)
p1_2d = p1[:2]
p2_2d = p2[:2]
p3_2d = p3[:2]
# 检查共线性
if np.linalg.matrix_rank([p2_2d - p1_2d, p3_2d - p1_2d]) < 2:
return None, None
# 构建2x2系数矩阵
A = np.array([
[2*(p2_2d[0] - p1_2d[0]), 2*(p2_2d[1] - p1_2d[1])],
[2*(p3_2d[0] - p2_2d[0]), 2*(p3_2d[1] - p2_2d[1])]
])
# 构建常数项
b = np.array([
p2_2d[0]**2 - p1_2d[0]**2 + p2_2d[1]**2 - p1_2d[1]**2,
p3_2d[0]**2 - p2_2d[0]**2 + p3_2d[1]**2 - p2_2d[1]**2
])
try:
center_2d = np.linalg.solve(A, b)
radius = np.linalg.norm(center_2d - p1_2d)
# 恢复z坐标为三点平均值
z_center = (p1[2] + p2[2] + p3[2]) / 3
return np.array([center_2d[0], center_2d[1], z_center]), radius
except np.linalg.LinAlgError:
return None, None
def detect_circle_radom_3_points(points,retry_num=3):
circle_points=[]
circle_r=[]
for j in range(retry_num):
# 打乱点集顺序
shuffled_points = np.random.permutation(points)
i = 0
while i < len(shuffled_points) - 2:
# 取连续三个不重复的点
triplet = shuffled_points[i:i+3]
# 计算圆心和半径
center, radius = calculate_circle(*triplet)
if center is not None and radius is not None:
circle_points.append(center)
circle_r.append(radius)
# 跳过已处理的点
i += 3
return circle_points, circle_r
def detect_circle(circle_points,circle_r):
if len(circle_points) > 0:
# 过滤异常半径(超过1.5倍IQR)
radii = np.array(circle_r)
q75, q25 = np.percentile(radii, [75, 25])
iqr = q75 - q25
mask = (radii > q25 - 1.5*iqr) & (radii < q75 + 1.5*iqr)
# 计算加权平均值(根据半径密度加权)
filtered_points = np.array(circle_points)[mask]
filtered_radii = radii[mask]
# 使用核密度估计找到最密集区域
kde = gaussian_kde(filtered_radii)
xvals = np.linspace(min(filtered_radii), max(filtered_radii), 100)
kde_vals = kde(xvals)
best_radius = xvals[np.argmax(kde_vals)]
# 找到对应半径的所有圆心
candidate_centers = filtered_points[np.abs(filtered_radii - best_radius) < iqr*0.5]
# 取三维坐标中位数作为最终圆心
final_center = np.median(candidate_centers, axis=0)
final_radius = np.median(filtered_radii)
return final_center,final_radius
def detect_tube(ply_file,choose_depth=10):
# 读取PLY文件
ply_data = PlyData.read(ply_file)
vertices = ply_data['vertex']
# 提取坐标数据
x = vertices['x']
y = vertices['y']
z = vertices['z']
# 计算深度范围
min_depth = np.min(z)
max_depth = np.max(z)
depth_range = max_depth - min_depth
# 筛选深度在指定范围内的点
x_list = []
y_list = []
z_list = []
# 动态计算bins数量(每个区间宽度为choose_depth)
num_bins = int(np.ceil(depth_range / choose_depth))
# 生成直方图
hist, bin_edges = np.histogram(z, bins=num_bins, range=(min_depth, max_depth))
max_bin_index = np.argmax(hist)
z_min = bin_edges[max_bin_index]
z_max = bin_edges[max_bin_index + 1]
x_list = []
y_list = []
z_list = []
# 筛选最密集区间内的点
for i in range(len(z)):
if z[i] >= z_min and z[i] <= z_max:
x_list.append(x[i])
y_list.append(y[i])
z_list.append(z[i])
# 在筛选点之后添加以下代码
points = np.column_stack((x_list, y_list, z_list))
circle_points = []
circle_r = []
circle_points,circle_r = detect_circle_radom_3_points(points)
circle = detect_circle(circle_points,circle_r)
colors = []
for depth in z:
# 将深度映射到颜色索引 (0-255)
color_idx = int(((depth - min_depth) / depth_range) * (len(color_map)-1))
colors.append(color_map[color_idx])
# 转换为0-1范围的RGB值
colors = np.array(colors) / 255.0
# 创建3D可视化
fig = plt.figure(figsize=(10, 8))
ax = fig.add_subplot(111, projection='3d')
# 绘制原始点云
ax.scatter(x, y, z, c=colors, s=1, marker='o', label='原始点云')
# 绘制筛选后的点云(红色突出显示)
# ax.scatter(x_list, y_list, z_list, c="black", s=1, marker='o', label='筛选点')
# 绘制筛选后的圆心和半径
# if len(circle_points) > 0:
# for center, radius in zip(circle_points, circle_r):
# # 在XY平面生成圆环
# theta = np.linspace(0, 2*np.pi, 100)
# x_circle = center[0] + radius * np.cos(theta)
# y_circle = center[1] + radius * np.sin(theta)
# # 使用圆心Z坐标的平均值作为高度
# z_circle = np.full_like(x_circle, center[2])
# ax.plot(x_circle, y_circle, z_circle, color='red', linewidth=2,
# label='检测圆环' if center is circle_points[0] else "")
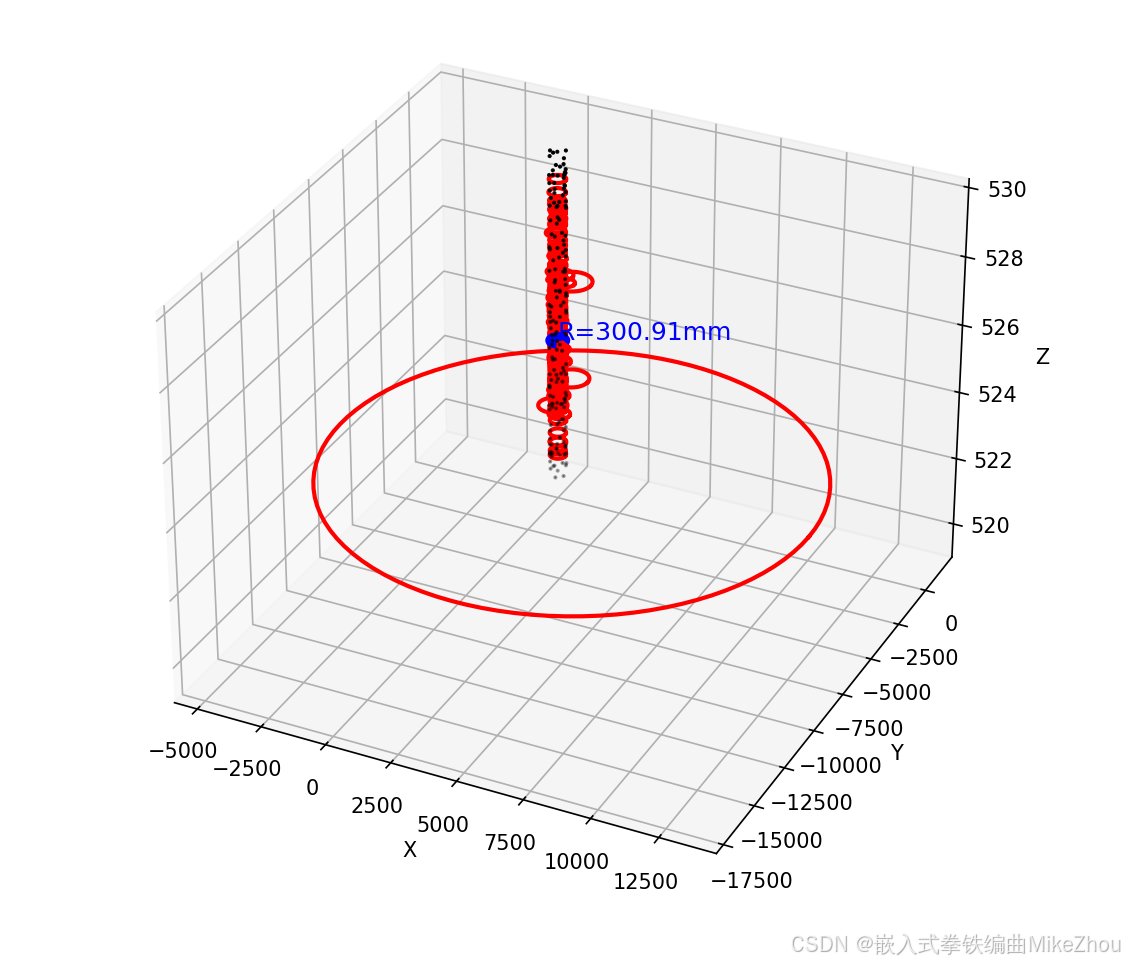
print(circle)
if len(circle[0]) and circle[1]:
# 生成更密集的点用于最终圆环
theta_final = np.linspace(0, 2*np.pi, 500)
x_final = circle[0][0] + circle[1] * np.cos(theta_final)
y_final = circle[0][1] + circle[1] * np.sin(theta_final)
z_final = np.full_like(theta_final, circle[0][2])
# 使用蓝色粗线突出显示
ax.plot(x_final, y_final, z_final, color='blue', linewidth=4,
linestyle='--', label='最终检测圆环')
# 添加半径标注
ax.text(circle[0][0], circle[0][1], circle[0][2],
f'R={circle[1]:.2f}mm', color='blue', fontsize=12)
# 设置坐标轴标签
ax.set_xlabel('X')
ax.set_ylabel('Y')
ax.set_zlabel('Z')
plt.show(block=True) # 添加block=True参数保持窗口显示
if __name__ == "__main__":
detect_tube('tube.ply')优化方案
对于算法优化 可以从1/2、1/4个点中来进行取值和拟合 以减小算法开销
另外 也可以用几何规律方法、最小二乘法来进行拟合
标准差计算更新
增加了最终结果的标准差计算,使其与原始值相比较
设定为大于50则不认定拟合成功 并画出黑色的圆
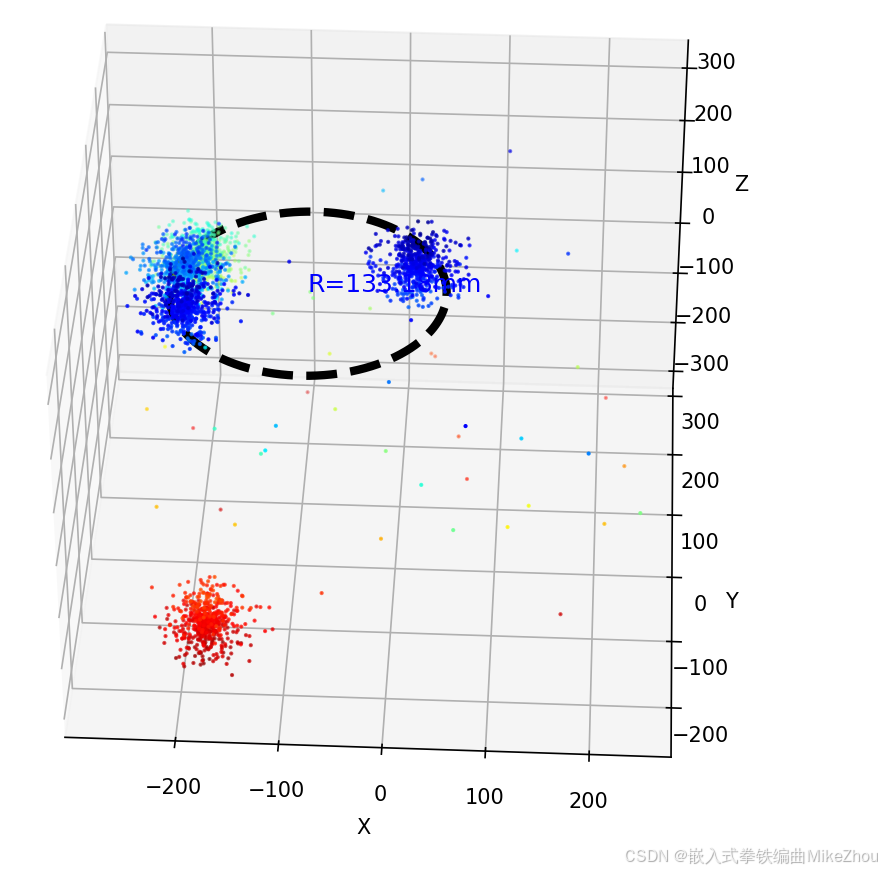
python
radius_std = np.std(filtered_radii - final_radius)如果拟合成功 则还是蓝色的圆:
附录:列表的赋值类型和py打包
列表赋值
BUG复现
闲来无事写了个小程序 代码如下:
python
# -*- coding: utf-8 -*-
"""
Created on Fri Nov 19 19:47:01 2021

@author: 16016
"""

a_list = ['0','1','2','3','4','5','6','7','8','9','10','11','12','13','14','15']
#print(len(a_list))
#b_list = ['','','','','','','','','','','','','','','','']
c_list = [[],[],[],[],[],[],[],[],[],[],[],[],[],[],[],[]]
#for i in range(16):
if len(a_list):
    for j in range(16):
        a_list[j]=str(a_list[j])+'_'+str(j)
        print("序号:",j)
        print('a_list:\n',a_list)


        c_list[j]=a_list
        print('c_list[0]:\n',c_list[0])
        print('\n')
#        b_list[j]=a_list[7],a_list[8]
#        print(b_list[j])
        # 写入到Excel:
#print(c_list,'\n')
我在程序中 做了一个16次的for循环 把列表a的每个值后面依次加上"_"和循环序号
比如循环第x次 就是把第x位加上_x 这一位变成x_x 我在输出测试中 列表a的每一次输出也是对的
循环16次后列表a应该变成'0_0', '1_1', '2_2', '3_3', '4_4', '5_5', '6_6', '7_7', '8_8', '9_9', '10_10', '11_11', '12_12', '13_13', '14_14', '15_15' 这也是对的
同时 我将每一次循环时列表a的值 写入到空列表c中 比如第x次循环 就是把更改以后的列表a的值 写入到列表c的第x位
第0次循环后 c0的值应该是'0_0', '1', '2', '3', '4', '5', '6', '7', '8', '9', '10', '11', '12', '13', '14', '15' 这也是对的
但是在第1次循环以后 c0的值就一直在变 变成了cx的值
相当于把c_list0变成了c_list1...以此类推 最后得出的列表c的值也是每一项完全一样
我不明白这是怎么回事
我的c0只在第0次循环时被赋值了 但是后面它的值跟着在改变
如图:

第一次老出bug 赋值以后 每次循环都改变c0的值 搞了半天都没搞出来
无论是用appen函数添加 还是用二维数组定义 或者增加第三个空数组来过渡 都无法解决
代码改进
后来在我华科同学的指导下 突然想到赋值可以赋的是个地址 地址里面的值一直变化 导致赋值也一直变化 于是用第二张图的循环套循环深度复制实现了
代码如下:
python
# -*- coding: utf-8 -*-
"""
Created on Fri Nov 19 19:47:01 2021

@author: 16016
"""

a_list = ['0','1','2','3','4','5','6','7','8','9','10','11','12','13','14','15']
#print(len(a_list))
#b_list = ['','','','','','','','','','','','','','','','']
c_list = [[],[],[],[],[],[],[],[],[],[],[],[],[],[],[],[]]
#for i in range(16):
if len(a_list):
    for j in range(16):
        a_list[j]=str(a_list[j])+'_'+str(j)
        print("序号:",j)
        print('a_list:\n',a_list)


        for i in range(16):
            c_list[j].append(a_list[i])
        print('c_list[0]:\n',c_list[0])
        print('\n')
#        b_list[j]=a_list[7],a_list[8]
#        print(b_list[j])
        # 写入到Excel:
print(c_list,'\n')
解决了问题

优化
第三次是请教了老师 用copy函数来赋真值
代码如下:
python
# -*- coding: utf-8 -*-
"""
Created on Fri Nov 19 19:47:01 2021

@author: 16016
"""

a_list = ['0','1','2','3','4','5','6','7','8','9','10','11','12','13','14','15']
#print(len(a_list))
#b_list = ['','','','','','','','','','','','','','','','']
c_list = [[],[],[],[],[],[],[],[],[],[],[],[],[],[],[],[]]
#for i in range(16):
if len(a_list):
    for j in range(16):
        a_list[j]=str(a_list[j])+'_'+str(j)
        print("序号:",j)
        print('a_list:\n',a_list)


        c_list[j]=a_list.copy()
        print('c_list[0]:\n',c_list[0])
        print('\n')
#        b_list[j]=a_list[7],a_list[8]
#        print(b_list[j])
        # 写入到Excel:
#print(c_list,'\n')
同样能解决问题

最后得出问题 就是指针惹的祸!
a_list指向的是个地址 而不是值 a_listi指向的才是单个的值 copy()函数也是复制值而不是地址
如果这个用C语言来写 就直观一些了 难怪C语言是基础 光学Python不学C 遇到这样的问题就解决不了
C语言yyds Python是什么垃圾弱智语言
总结
由于Python无法单独定义一个值为指针或者独立的值 所以只能用列表来传送
只要赋值是指向一个列表整体的 那么就是指向的一个指针内存地址 解决方法只有一个 那就是将每个值深度复制赋值(子列表内的元素提取出来重新依次连接) 或者用copy函数单独赋值
如图测试:


部分代码:
python
# -*- coding: utf-8 -*-
"""
Created on Sat Nov 20 16:45:48 2021

@author: 16016
"""

def text1():
    A=[1,2,3]
    B=[[],[],[]]
    for i in range(len(A)):
        A[i]=A[i]+i
        B[i]=A
        print(B)

def text2():
    A=[1,2,3]
    B=[[],[],[]]

    A[0]=A[0]+0
    B[0]=A
    print(B)
    A[1]=A[1]+1
    B[1]=A
    print(B)
    A[2]=A[2]+2
    B[2]=A
    print(B)

if __name__ == '__main__':
    text1()
    print('\n')
    text2()
py打包
Pyinstaller打包exe(包括打包资源文件 绝不出错版)
依赖包及其对应的版本号
PyQt5 5.10.1
PyQt5-Qt5 5.15.2
PyQt5-sip 12.9.0
pyinstaller 4.5.1
pyinstaller-hooks-contrib 2021.3
Pyinstaller -F setup.py 打包exe
Pyinstaller -F -w setup.py 不带控制台的打包
Pyinstaller -F -i xx.ico setup.py 打包指定exe图标打包
打包exe参数说明:
-F:打包后只生成单个exe格式文件;
-D:默认选项,创建一个目录,包含exe文件以及大量依赖文件;
-c:默认选项,使用控制台(就是类似cmd的黑框);
-w:不使用控制台;
-p:添加搜索路径,让其找到对应的库;
-i:改变生成程序的icon图标。
如果要打包资源文件
则需要对代码中的路径进行转换处理
另外要注意的是 如果要打包资源文件 则py程序里面的路径要从./xxx/yy换成xxx/yy 并且进行路径转换
但如果不打包资源文件的话 最好路径还是用作./xxx/yy 并且不进行路径转换
python
def get_resource_path(relative_path):
    if hasattr(sys, '_MEIPASS'):
        return os.path.join(sys._MEIPASS, relative_path)
    return os.path.join(os.path.abspath("."), relative_path)
而后再spec文件中的datas部分加入目录
如:
python
a = Analysis(['cxk.py'],
             pathex=['D:\\Python Test\\cxk'],
             binaries=[],
             datas=[('root','root')],
             hiddenimports=[],
             hookspath=[],
             hooksconfig={},
             runtime_hooks=[],
             excludes=[],
             win_no_prefer_redirects=False,
             win_private_assemblies=False,
             cipher=block_cipher,
             noarchive=False)
而后直接Pyinstaller -F setup.spec即可
如果打包的文件过大则更改spec文件中的excludes 把不需要的库写进去(但是已经在环境中安装了的)就行
这些不要了的库在上一次编译时的shell里面输出
比如:


然后用pyinstaller --clean -F 某某.spec