摘 要
随着社交媒体的普及和互联网技术的快速发展,热点舆情事件频发,对于政府、企业和公众来说,及时了解和分析热点舆情,把握舆论走向,已经成为一项重要的任务。然而,传统的数据处理和分析方法在面对海量、实时的舆情数据时,显得力不从心,无法满足及时、准确、全面的分析需求。因此,本研究利用Hadoop、Hive等技术,以微博数据为例,对热点舆情进行了全面的分析。
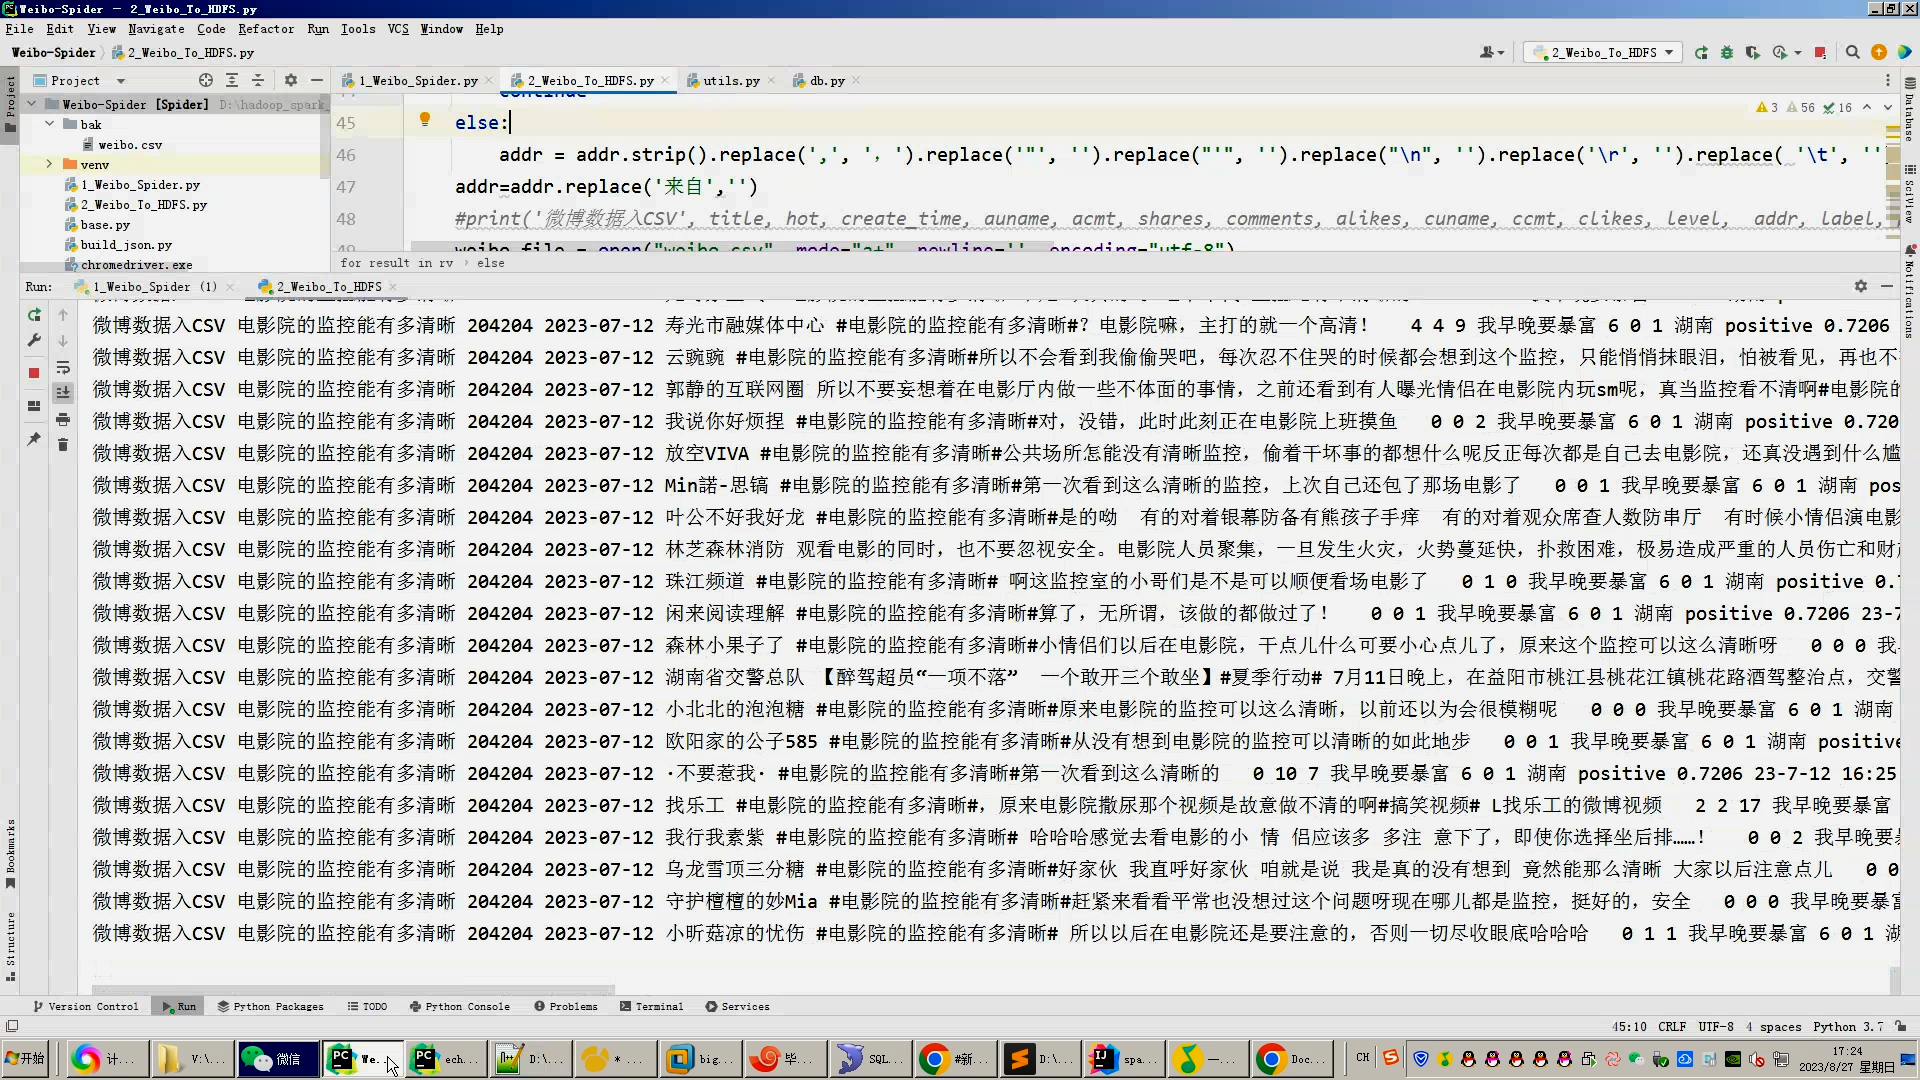
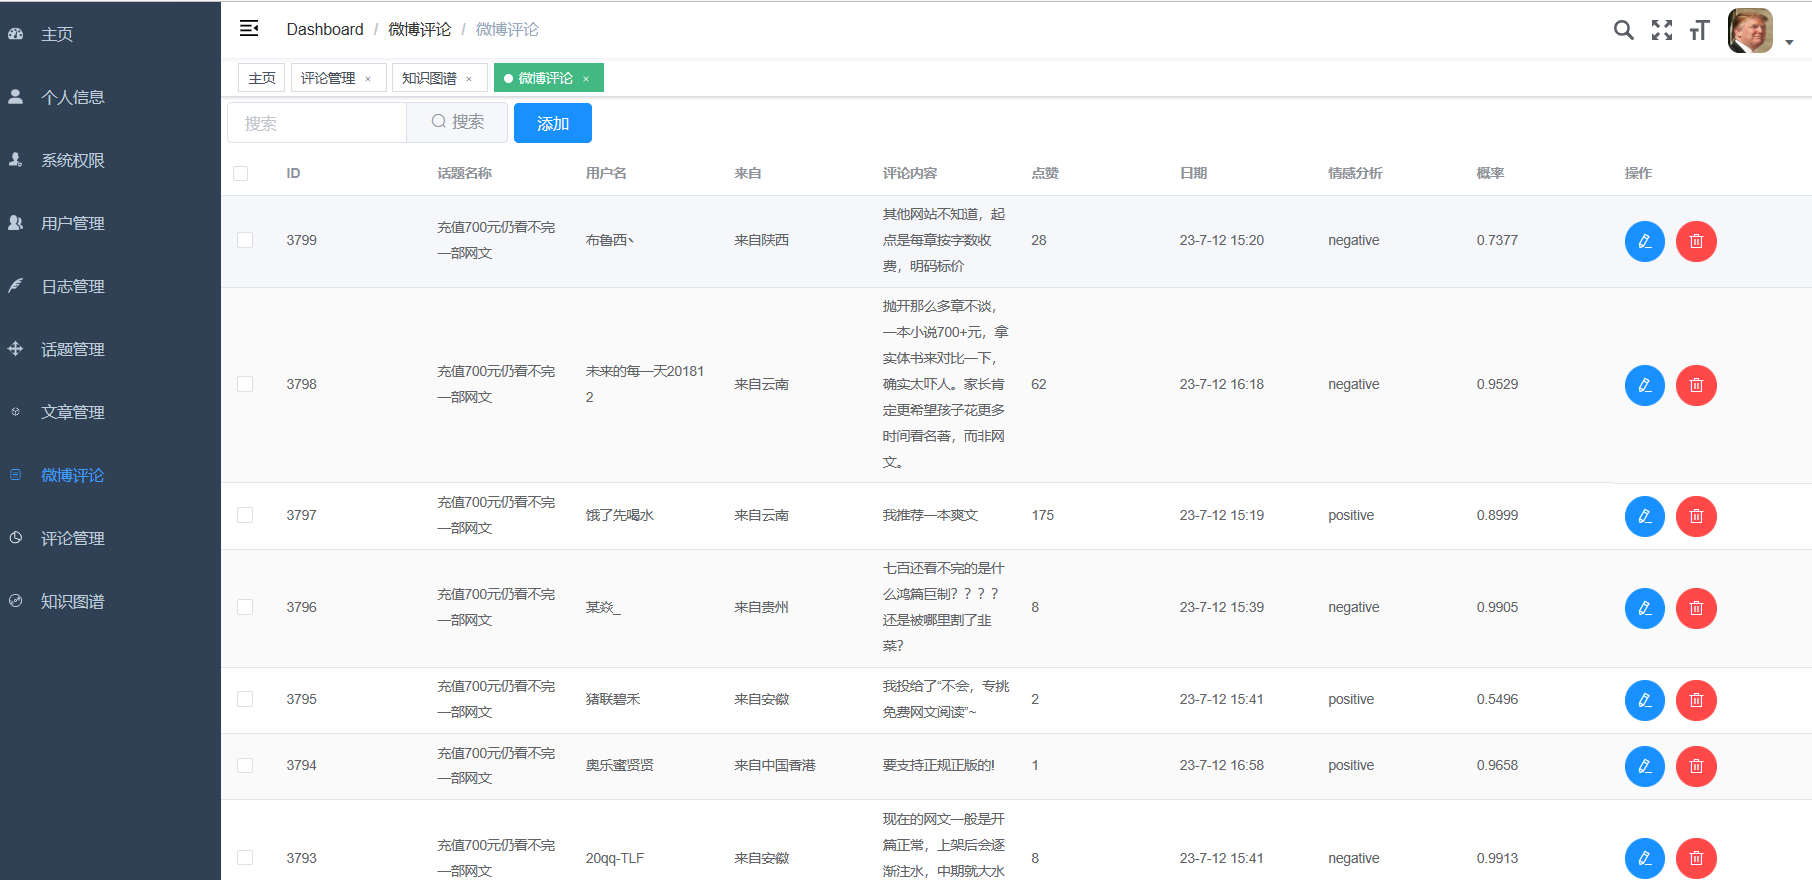
针对微博数据的爬取问题,本系统使用了Selenium实现了数据的自动化爬取并将数据存入MySQL数据库。能够高效地爬取大量的微博数据,包括标题、热度、时间、作者、省份、转发,热搜等信息。
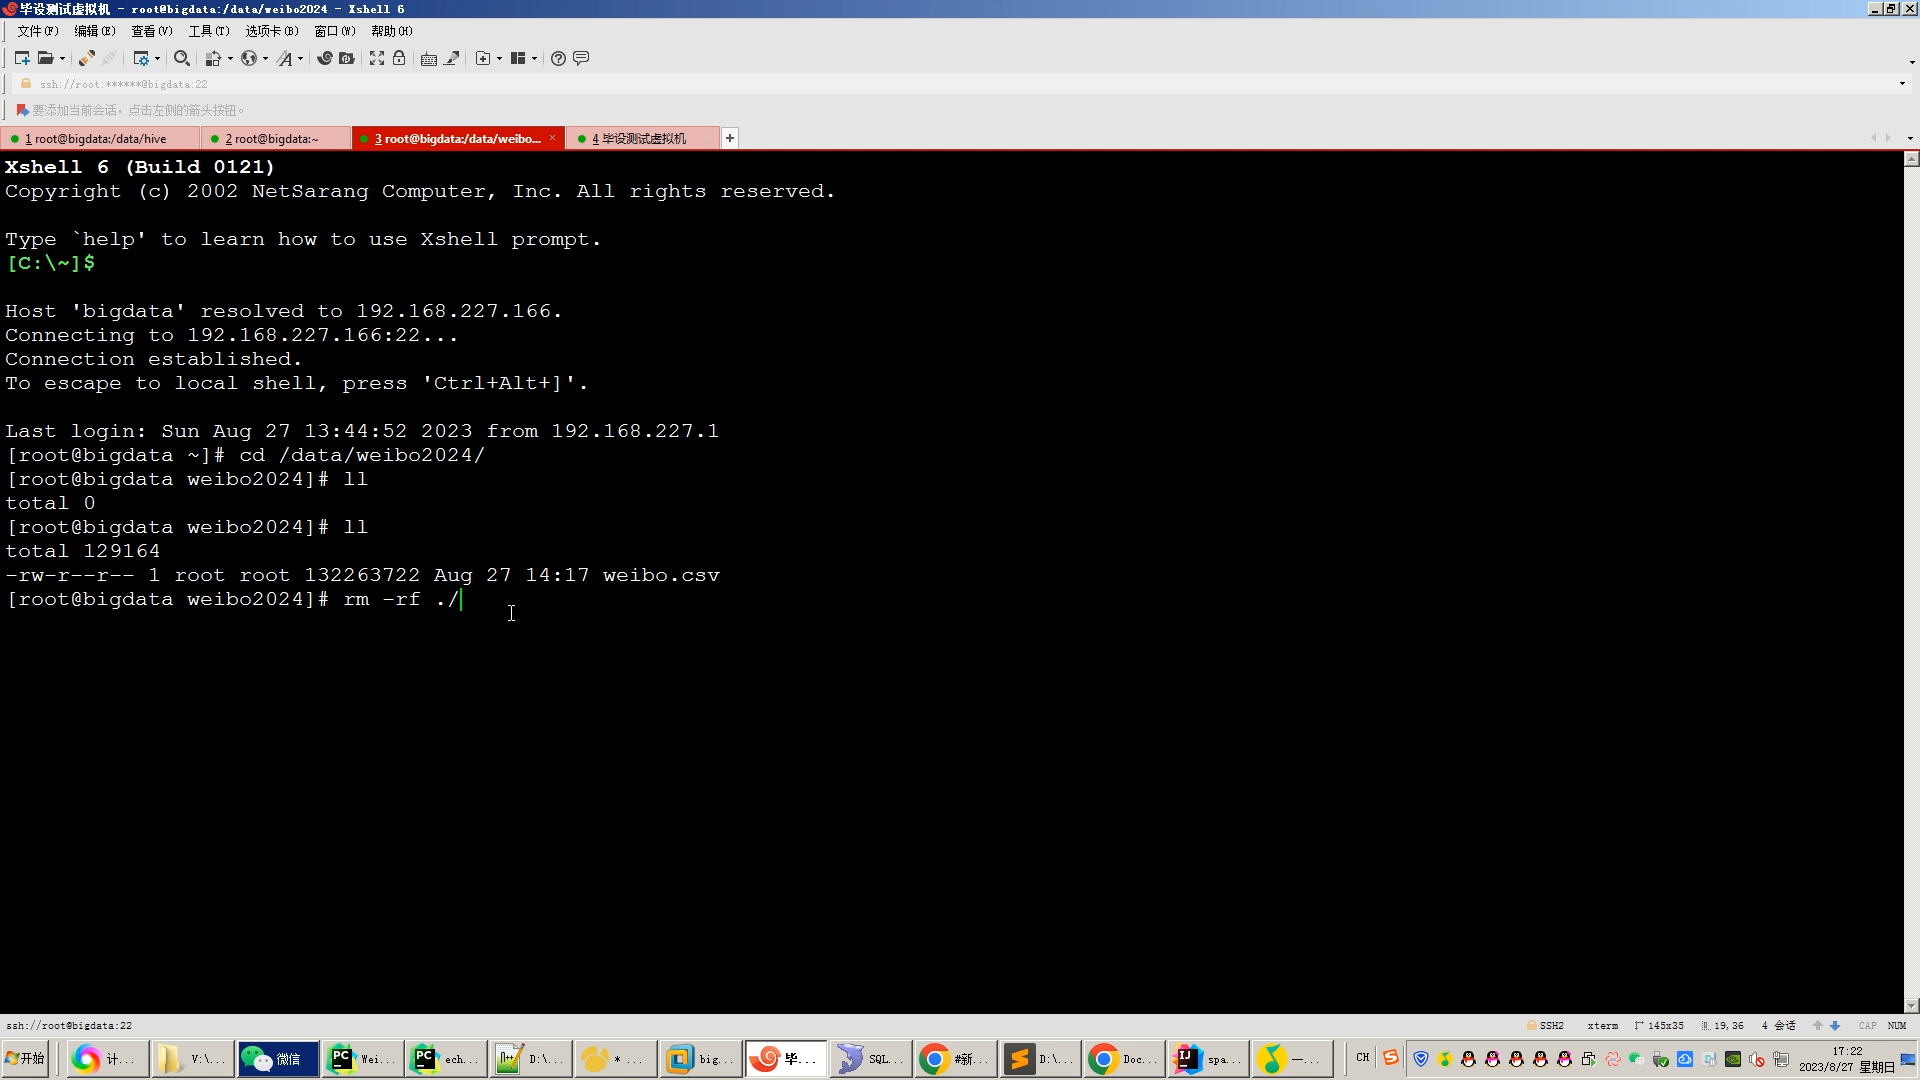
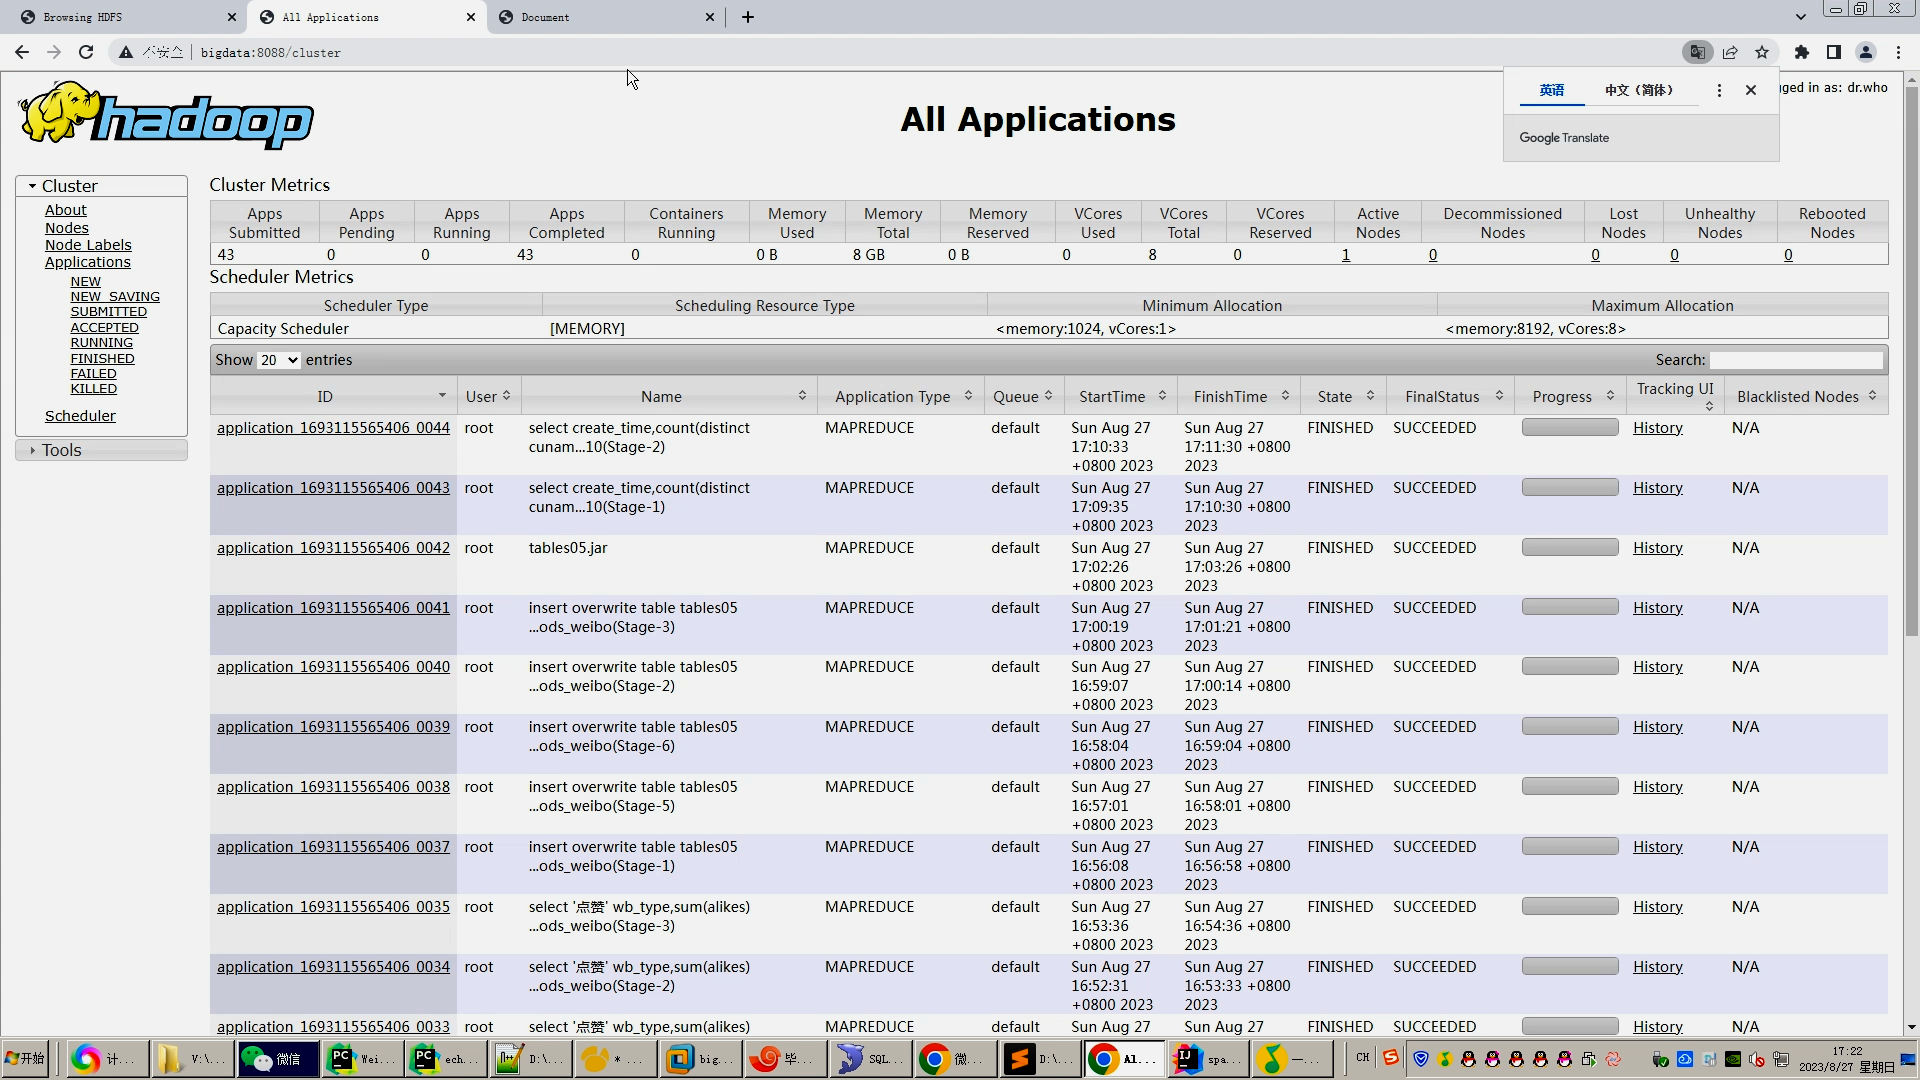
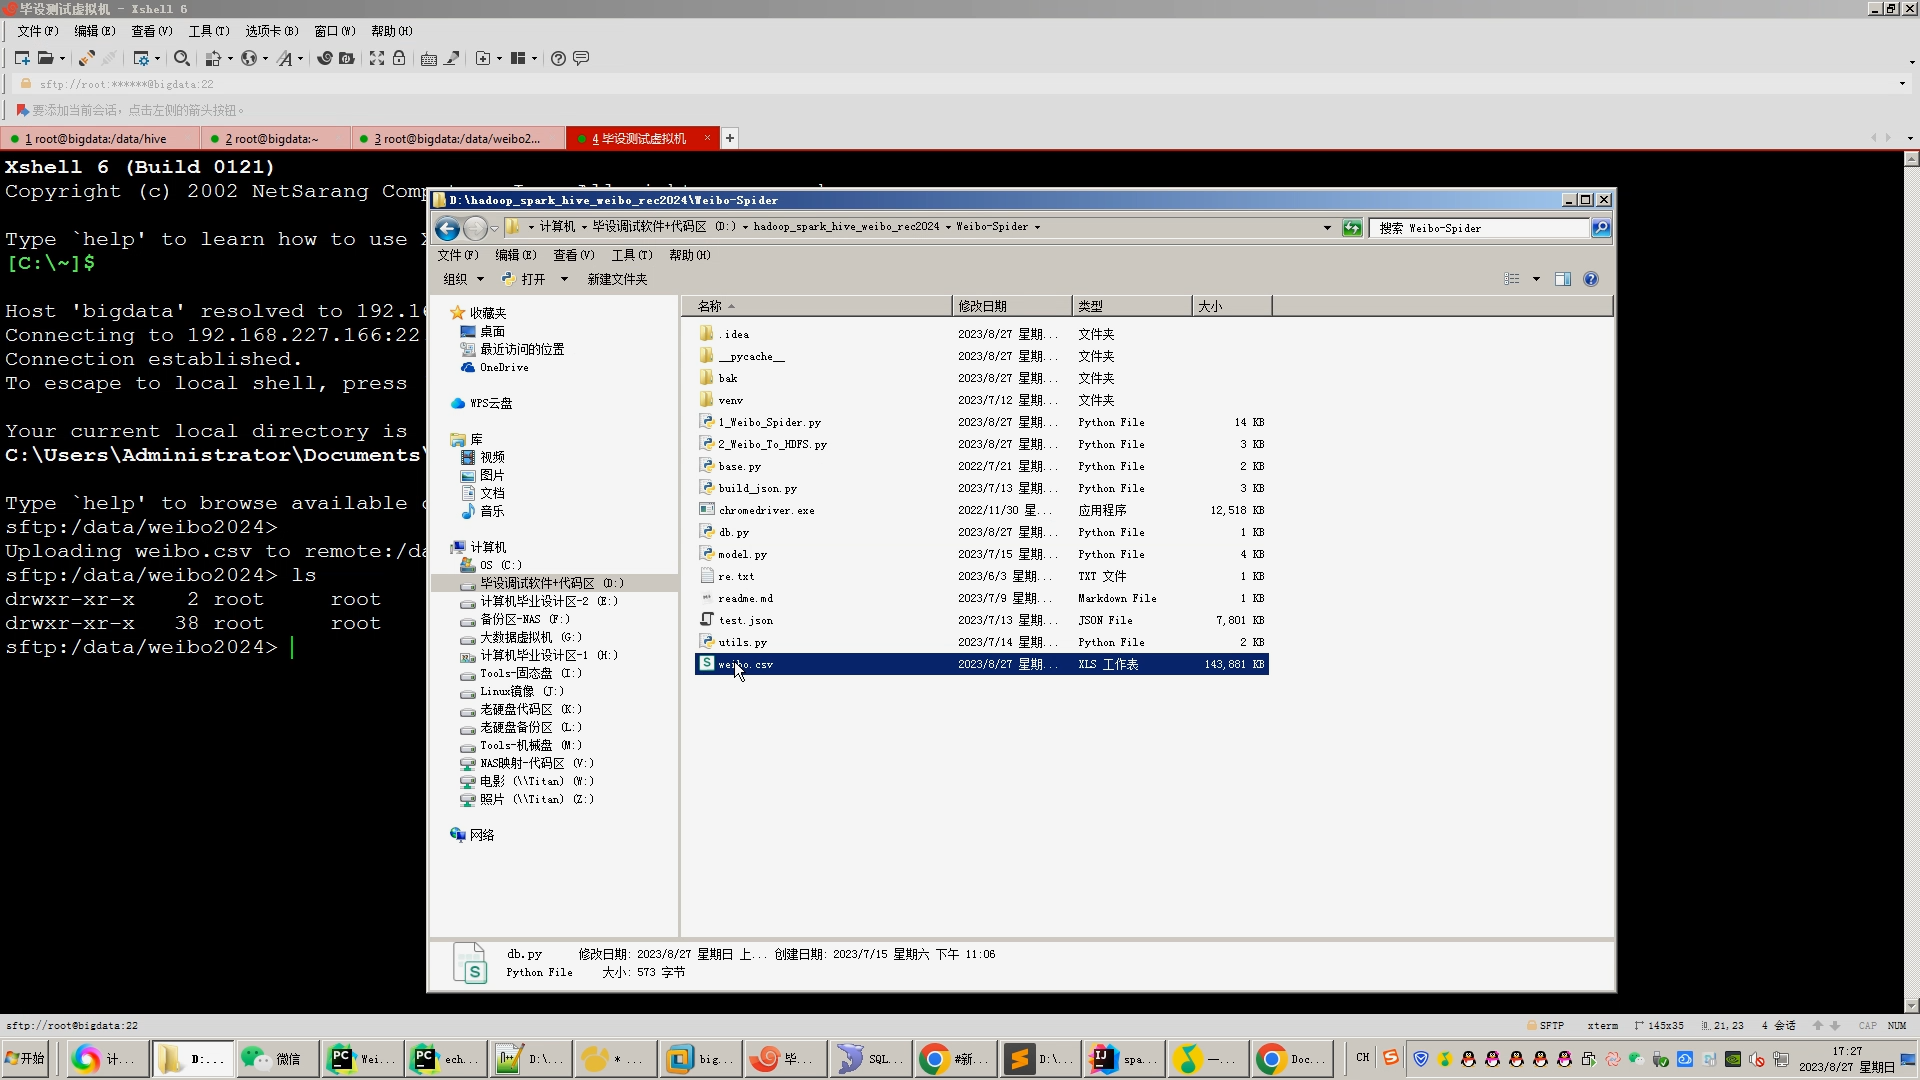
对于海量的数据预处理方面,本系统使用mapreduce进行数据的预处理。将MySQL中的数据进行切分、排序、合并、归约等操作分布式进行,实现了快速高效地数据预处理。接着,对于数据的上传问题,将预处理好的数据转为.csv文件上传HDFS文件系统,再使用Hive建库建表,导入.csv数据集,以方便进行数据分析和可视化。
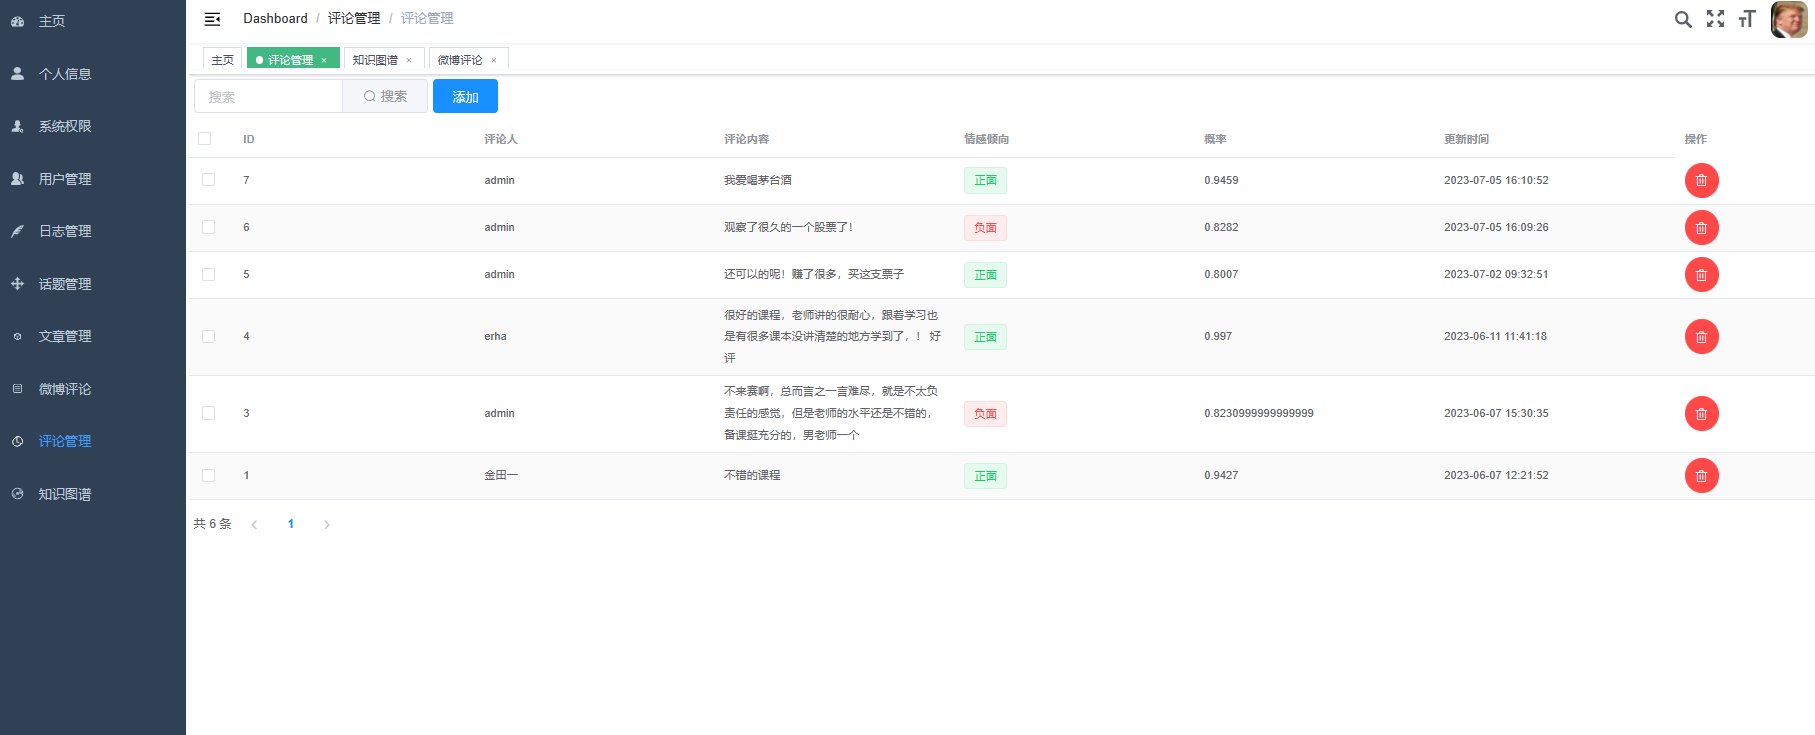
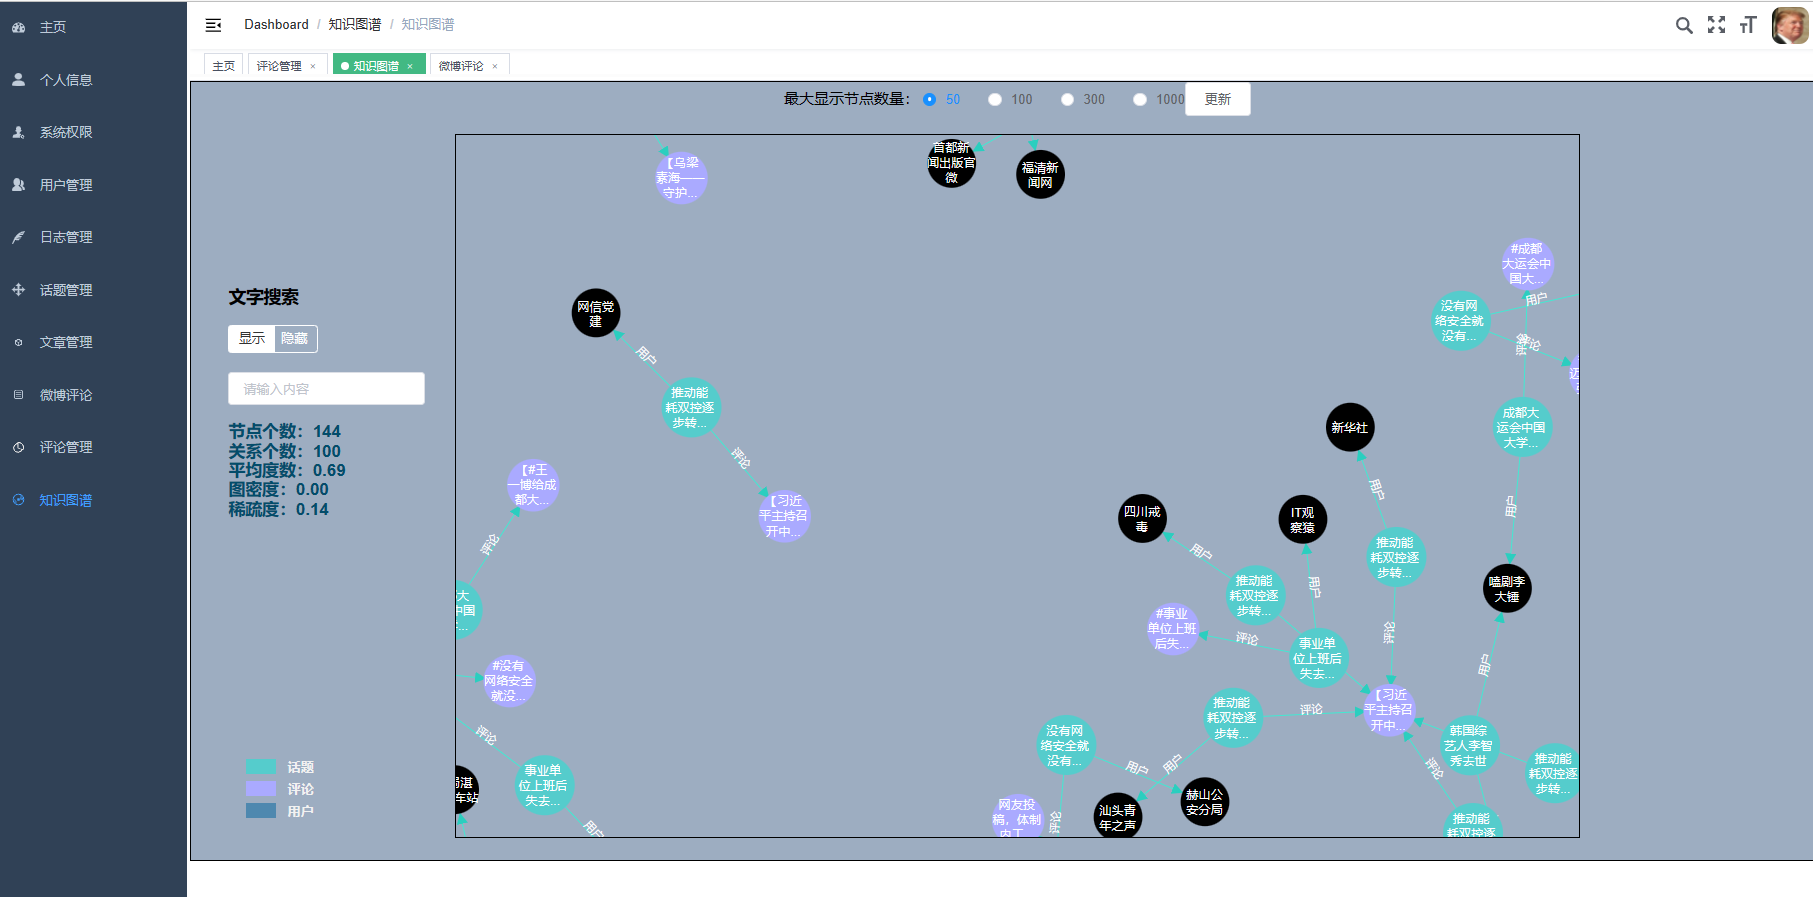
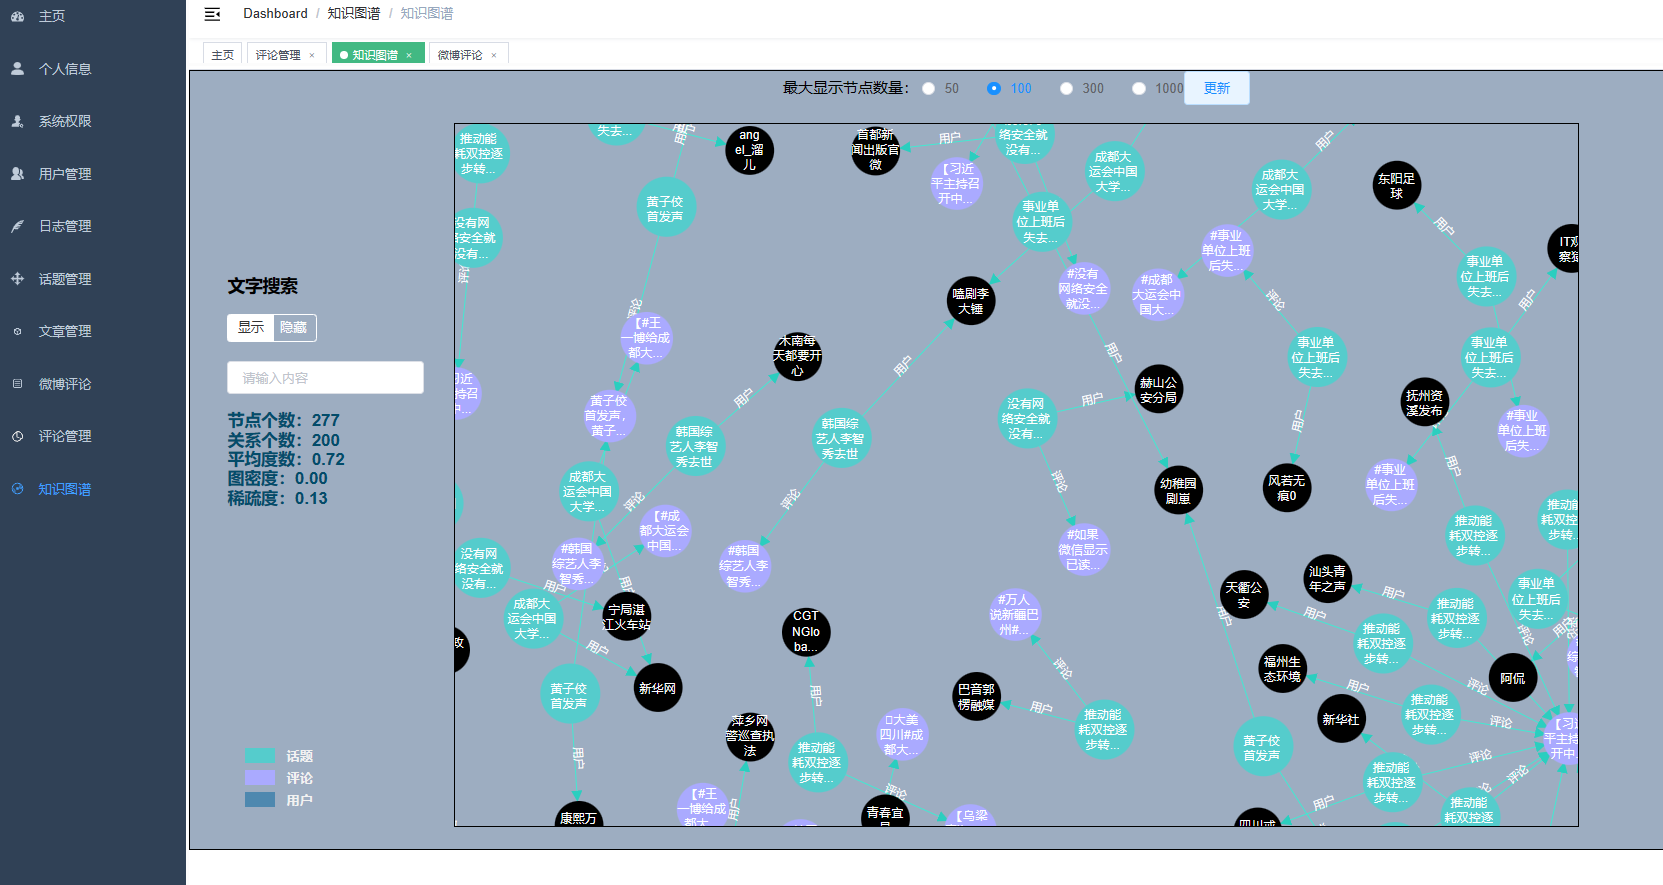
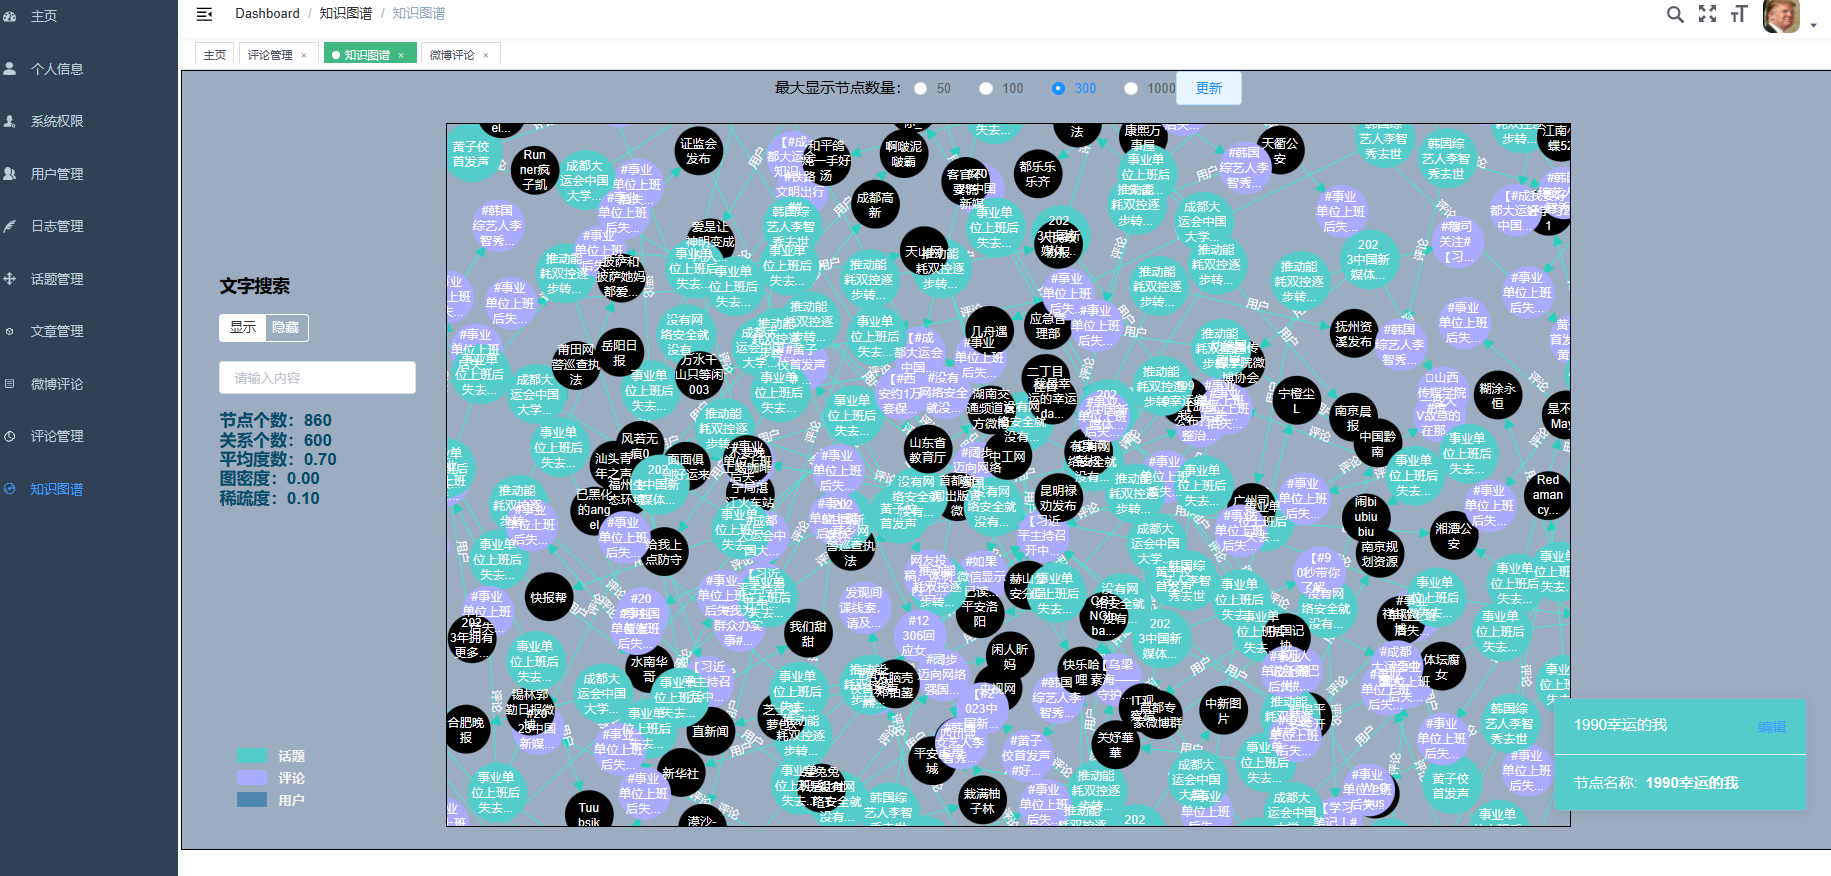
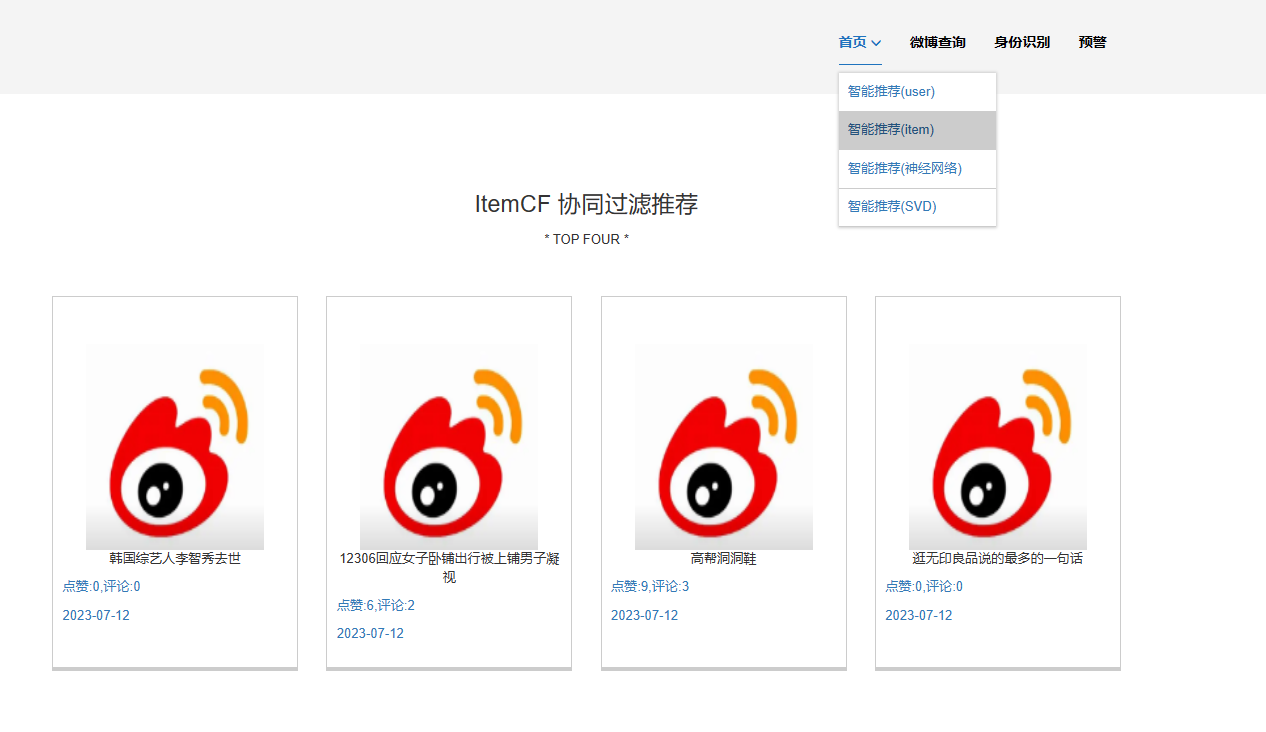
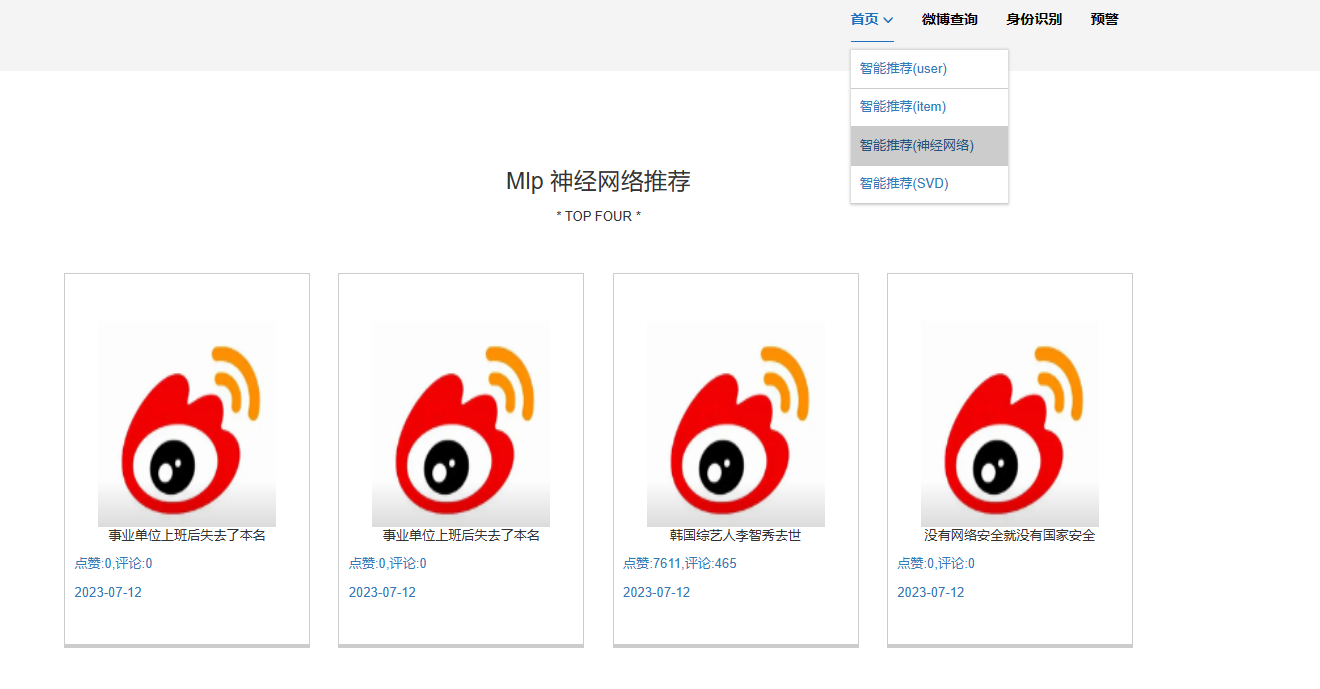
面对微博数据的分析和可视化问题,系统通过Hive进行数据分析,能够快速地对微博数据进行聚合和筛选。将分析结果使用sqoop导入MySQL数据库,使用Flask和Echarts,则能够直观地将数据进行可视化,例如绘制出微博数据的饼状图、散点图、柱状图,地图等,以便于分析和决策。
综上所述,系统通过以上步骤实现了微博数据的自动化爬取、海量数据的高效预处理、 数据的分布式上传以及数据的快速分析和可视化。这一研究能够为航空公司等相关企业 提供数据支持,以便于进行航班线路的优化和决策。
关键词:Hadoop;舆情;Hive;Sqoop;可视化
论文类型:软件工程
Abstract
With the popularity of social media and the rapid development of Internet technology, hot public opinion events occur frequently. For the government, enterprises and the public, it has become an important task to timely understand and analyze hot public opinion and grasp the trend of public opinion. However, the traditional data processing and analysis methods are powerless in the face of massive and real-time public opinion data, and cannot meet the needs of timely, accurate and comprehensive analysis. Therefore, this study uses Hadoop, Hive and other technologies to conduct a comprehensive analysis of hot public opinion by taking microblog data as an example.
Aiming at the crawling problem of microblog data, this system uses Selenium to realize the automatic crawling of data and store the data into MySQL database. It can efficiently crawl a large number of microblog data, including title, popularity, time, author, province, forwarding, hot search and other information.
For massive data preprocessing, the system uses mapreduce for data preprocessing. The data in MySQL is divided, sorted, merged, reduced and other operations are distributed to achieve fast and efficient data preprocessing. Then, to facilitate data analysis and visualization, convert the preprocessed data into.csv files and upload them to the HDFS file system. Then use Hive to create libraries and tables and import.CSV data sets.
Faced with the problem of analysis and visualization of microblog data, the system uses Hive for data analysis, and can quickly aggregate and screen microblog data. Import the analysis results into MySQL database using sqoop, and use Flask and Echarts to visually visualize the data, such as drawing pie charts, scatter charts, bar charts, maps, etc., for easy analysis and decision making.
To sum up, the system realizes automatic crawling of microblog data, efficient pre-processing of massive data, distributed uploading of data, and rapid analysis and visualization of data through the above steps. This research can provide data support for relevant enterprises such as airlines, so as to optimize and make decisions on flight routes.
K ey Words : Hadoop; Public sentiment; Hive; Sqoop; visualization
目 录
[++++摘++++ ++++要++++](#摘 要)
[++++2.1++++ ++++Hadoop++++ ++++集群++++](#2.1 Hadoop 集群)
[++++2.2++++ ++++MySQ++++ ++++L++++](#2.2 MySQL)
[++++2.3++++ ++++Hive++++](#2.3 Hive)
[++++2.4++++ ++++Selenium++++](#2.4 Selenium)
[++++2.5++++ ++++ECharts++++](#2.5 ECharts)
[++++4.1++++ ++++MySQL++++ ++++部署++++](#4.1 MySQL 部署)
++++4.2++++ ++++Xshell++++ ++++部署++++
++++4.3++++ ++++Hadoop++++ ++++部署++++
++++4.4++++ ++++Hive++++ ++++部署++++
++++5.2.3爬取文章数据(用户姓名、内容,转发评论点赞数)++++
[++++致 谢++++](#致 谢)


核心算法代码分享如下:
python
import requests
import json
import pprint

def address(address):
    url="XXXXXXXXXXXXXXXXX"%('f1063cfc84a84bd3b1d3a339c87b8bd0',address)
    data=requests.get(url)
    contest=data.json()
    #返回经度和纬度
    print(contest)
    contest=contest['geocodes'][0]['location']
    return contest


if __name__ == '__main__':
    resp=address('北京市')
    print(resp)
    print(resp.split(',')[0])
    print(resp.split(',')[1])