作者:来自 Elastic Frederic Maussion
使用 OpenTelemetry 跟踪模块为 Nginx 进行埋点,并将 spans 导出到 Elastic Observability 的 APM,实现完整的端到端分布式追踪。
使用 Nginx 和 OpenTelemetry 的端到端可观测性
Nginx 位于大多数现代架构的最前端:处理 SSL、路由、负载均衡、认证等。然而,尽管它的角色至关重要,它在分布式追踪中往往缺席。
这个空缺会产生盲点,影响性能调试、用户体验分析和系统可靠性。
本文解释了为什么 Nginx 追踪在应用上下文中很重要 ,并提供了一个实用指南 ,说明如何启用 Nginx Otel 追踪模块,将 spans 直接导出到 Elastic APM。
为什么 Nginx 追踪对现代可观测性很重要
仅对后端服务进行监控只能看到一半的情况。
Nginx 能看到:
- 每个进入的请求
- 客户端 trace 上下文
- TLS 协商
- 上游错误 (502, 504)
- 边缘层延迟
- 路由决策
如果 Nginx 不在你的 traces 中,你的分布式追踪就是不完整的。
通过在这个入口层添加 OpenTelemetry 追踪,你可以解锁:
-
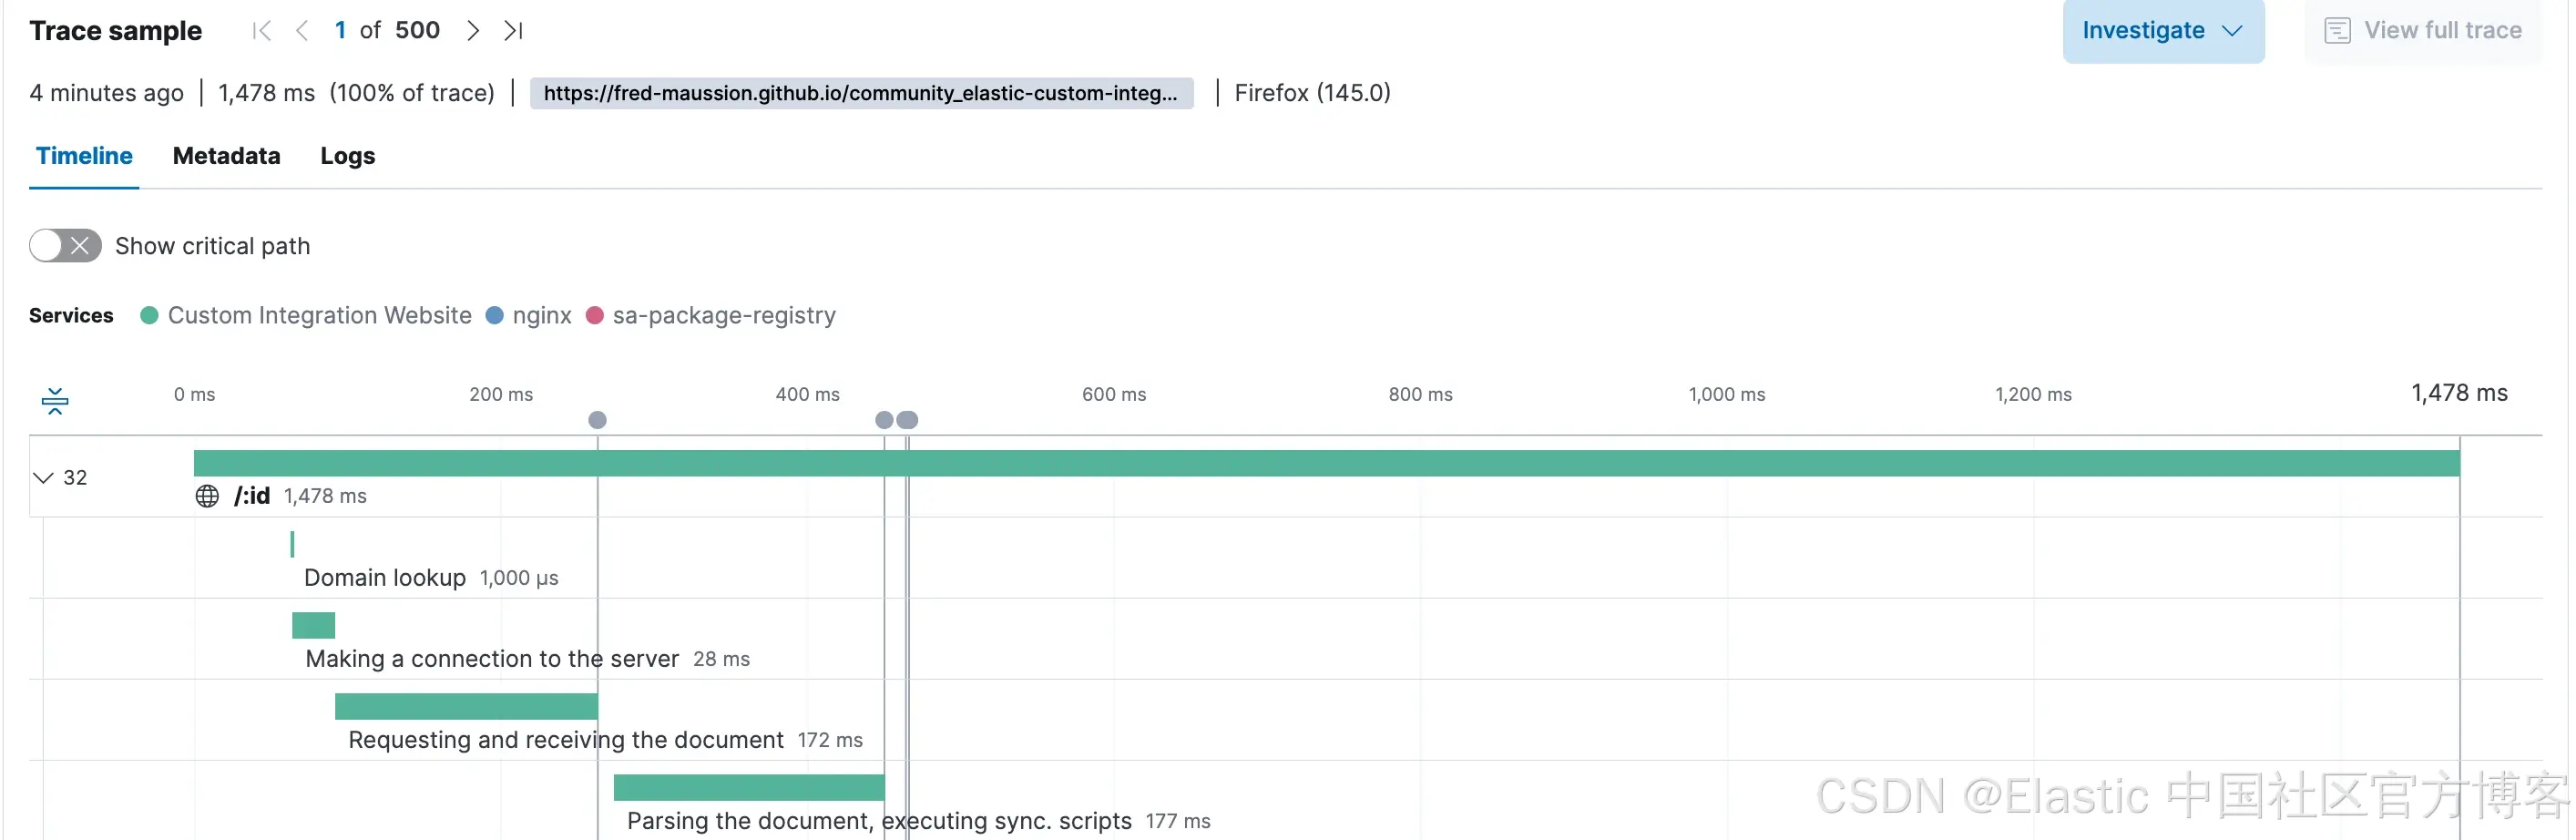
完整的追踪连续性 :从 browser → Nginx → 后端 → 数据库 。
-
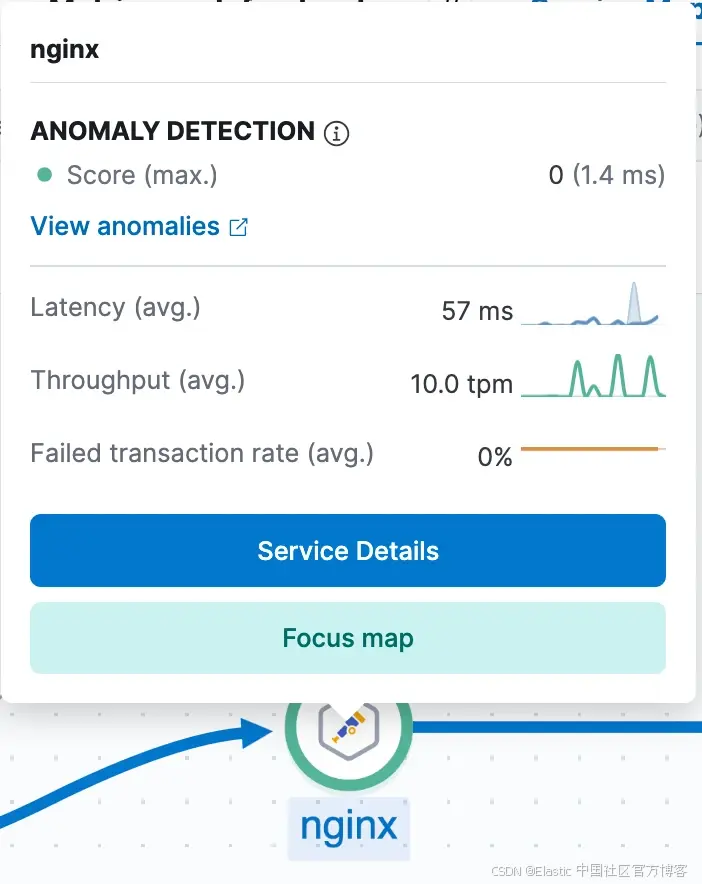
准确的延迟归因 :边缘延迟与后端延迟清晰分离,这使得 Elastic APM 延迟异常检测可以用于主动发现问题。
-
错误根因清晰:Nginx 错误以 spans 的形式出现,而不是后端的"神秘空白"。
-
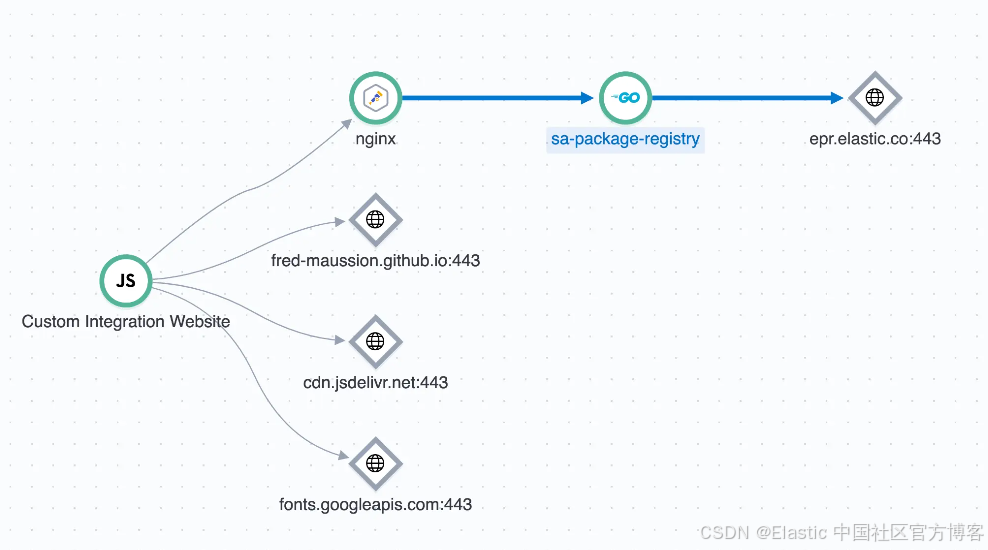
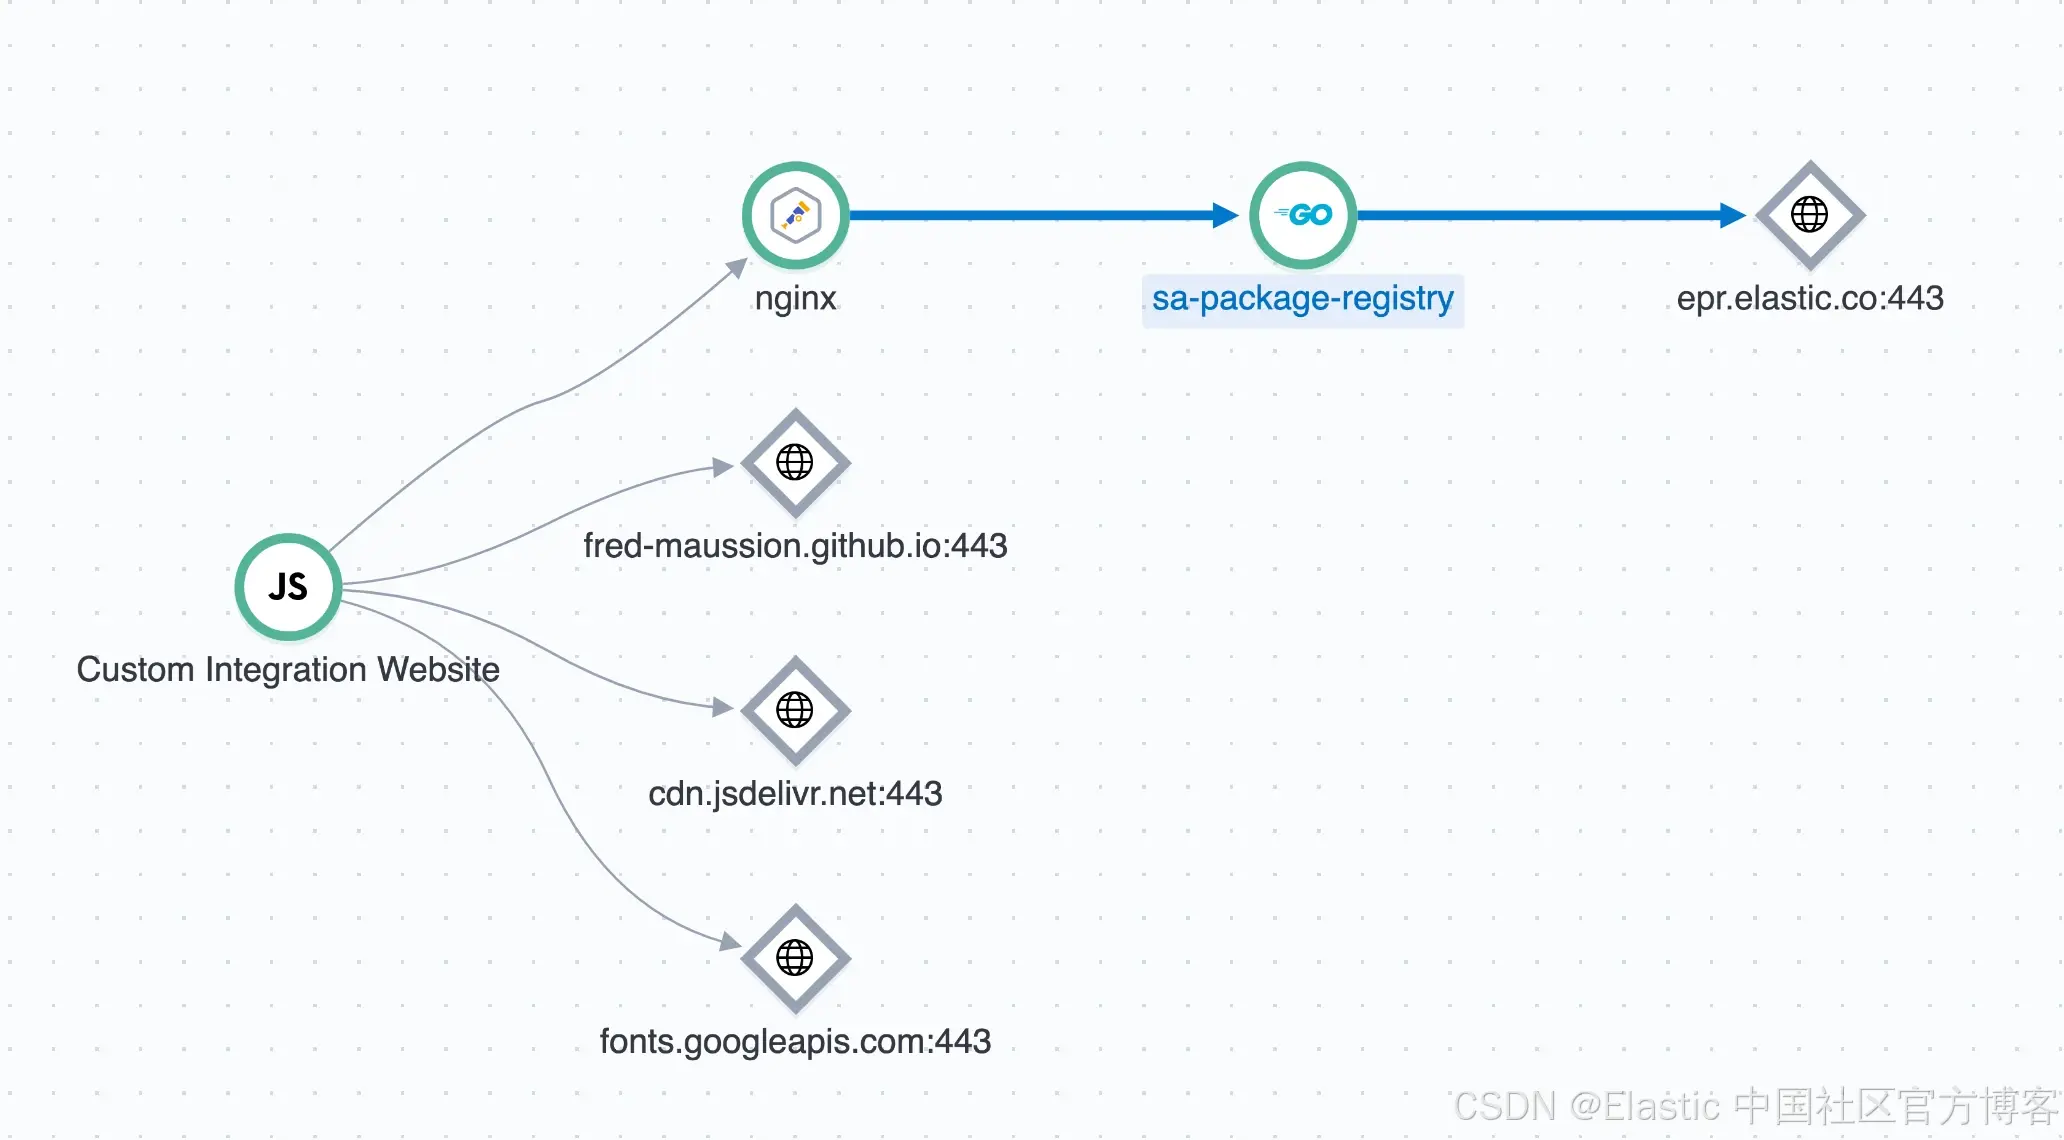
完整的服务拓扑 :你的 APM 服务地图终于显示真实的架构。
在 Debian 上将 Nginx 与 OpenTelemetry 集成
本指南提供了为什么以及如何在基于 Debian 的系统上安装和配置 Nginx OpenTelemetry 模块的全面概述。配置示例针对直接将遥测数据发送到 Elastic APM 端点,无论是 EDOT Collector 还是我们的无服务器 mOtel,实现端到端分布式追踪。
在 Debian 上安装
Nginx OTEL 模块不包含在标准 Nginx 软件包中。必须与可用的 nginx 配置一起安装。
先决条件
首先,安装编译软件所需的工具以及 Nginx 开发依赖。
sudo apt update
sudo apt install -y apt install nginx-module-otel
在 Nginx 中加载模块
编辑你的主 /etc/nginx/nginx.conf 文件以加载新模块。该指令必须位于顶层,在 http 块之前。
# /etc/nginx/nginx.conf

load_module modules/ngx_otel_module.so;

events {
    # ...
}

http {
    # ...
}
现在,测试你的配置并重启 Nginx。
sudo nginx -t
sudo systemctl restart nginx
配置
配置分为主 nginx.conf 文件(用于全局设置)和你的网站专用 server block 文件。
全局配置 (/etc/nginx/nginx.conf)
此配置设置你的遥测数据目标,并定义用于 CORS 和 tracing 的全局变量。这些设置放在 http 块内。
http {
    ...

    # --- OpenTelemetry Exporter Configuration ---
    # Defines where Nginx will send its telemetry data directly to Elastic APM or EDOT.
    otel_exporter {
        endpoint https://<ELASTIC_URL>:443;
        header Authorization "Bearer <TOKEN>";
    }

    # --- OpenTelemetry Service Metadata ---
    # These attributes identify Nginx as a unique service in the APM UI.
    otel_service_name nginx;
    otel_resource_attr service.version 1.28.0;
    otel_resource_attr deployment.environment production;
    otel_trace_context propagate; # Needed to propagate the RUM traces to the backend

    # --- Helper Variables for Tracing and CORS ---
    # Creates the $trace_flags variable needed to build the outgoing traceparent header.
    map $otel_parent_sampled $trace_flags {
        default "00"; # Not sampled
        "1"     "01"; # Sampled
    }

    # Creates the $cors_origin variable for secure, multi-origin CORS handling.
    map $http_origin $cors_origin {
        default "";
        "http://<URL_ORIGIN_1>/" $http_origin; # Add your Origin here to allow CORS
        "https://<URL_ORIGIN_2>/" $http_origin; # Add your others Origin here to allow CORS
    }
...
}
Server Block 配置 (/etc/nginx/conf.d/site.conf)
此配置为特定网站启用 tracing,处理 CORS 预检请求,并将 trace context 传递到后端服务。
server {
    listen 443 ssl;
    server_name <WEBSITE_URL>;

    # --- OpenTelemetry Module Activation ---
    # Enable tracing for this server block.
    otel_trace on;
    otel_trace_context propagate;

    location / {
        # --- CORS Preflight (OPTIONS) Handling ---
        # Intercepts preflight requests and returns the correct CORS headers,
        # allowing the browser to proceed with the actual request.
        if ($request_method = 'OPTIONS') {
            add_header 'Access-Control-Allow-Methods' 'GET, POST, OPTIONS' always;
            add_header 'Access-Control-Allow-Headers' 'Content-Type, traceparent, tracestate' always;
            add_header 'Access-Control-Max-Age' 86400;
            add_header 'Access-Control-Allow-Origin' "$cors_origin" always;
            return 204;
        }

        # --- OpenTelemetry Trace Context Propagation ---
        # Manually constructs the W3C traceparent header and passes the tracestate
        # header to the backend, linking this trace to the upstream service.
        proxy_set_header traceparent      "00-$otel_trace_id-$otel_span_id-$trace_flags";
        proxy_set_header tracestate       $http_tracestate;

        # --- Standard Proxy Headers ---
        proxy_set_header Host             $host;
        proxy_set_header X-Real-IP        $remote_addr;
        proxy_set_header X-Forwarded-For  $proxy_add_x_forwarded_for;
        proxy_set_header X-Forwarded-Proto $scheme;

        # --- Forward to Backend ---
        # Passes the request to the actual application (eg. localhost in this example).
        proxy_pass http://<BACKEND_URL>:8080;
    }
}
测试你的配置并重启 Nginx。
sudo nginx -t
sudo systemctl restart nginx
结论:将 Nginx 转变为一等观测信号
通过在 Nginx 中直接启用 OpenTelemetry tracing 并将 spans 导出到 Elastic APM(通过 EDOT 或 Elastic 的托管 OTLP endpoint),你将入口层纳入与堆栈其余部分相同的可观测性模型。结果包括:
- 从浏览器到后端服务的真正端到端 trace 连续性
- 边缘延迟与应用延迟的清晰分离
- 对网关级故障和重试的即时可见性
- 反映真实生产流量的准确服务图
最重要的是,这种方法使 Nginx 符合现代可观测性标准。它避免了专有的 instrumentation,自然适配基于 OpenTelemetry 的架构,并能在混合和云原生环境中一致扩展。
尝试一下!
一旦 Nginx tracing 就绪,还有几个自然扩展可以进一步提升你的可观测性:
- 使用 Elastic 的统一可观测性,将 Nginx traces 与应用日志和指标关联
- 添加 Real User Monitoring (RUM),闭合前端到后端的监控循环
- 在 collector 级别引入采样和尾部决策以控制成本
- 使用 Elastic APM 服务图和异常检测,主动发现边缘相关问题
为 Nginx 做 instrumentation 通常是分布式 tracing 策略中缺失的环节。借助 OpenTelemetry 和 Elastic,这一空白现在可以通过干净、基于标准、可生产使用的方式补上。
如果你想快速实验这个设置,Elastic Serverless 提供最快的起步方式。注册并在几分钟内使用我们的试用环境尝试,网址为 https://cloud.elastic.co/ 。
原文:https://www.elastic.co/observability-labs/blog/nginx-opentelemetry-end-to-end-tracing